Using Time-Lapse Satellite Imagery To Detect Infrastructure Changes: Case-Studies via Myanmar, Nigeria and the South China Sea
Translations:
Identifying changes in infrastructure is an important task for those of us surveilling areas for investigative purposes.
Satellite imagery can show evidence of everything from the destruction of buildings, the erection of temporary structures, as well as newly constructed permanent facilities.
This kind of information is important for analysis of events in conflict areas, as these areas often cannot be reached by unbiased observers. Satellite imagery can therefore tell a truer/more complete account of what occurred in a specific conflict area.
By being able to view changes taking place in a specific area, we can utilize free open-source tools which create what is effectively a time-lapse of the Earth’s surface.
Using imagery from the Copernicus Sentinel or NASA Landsat programs, which vary in their daily updates, a timeline of chronological satellite imagery can be compiled, contextualized, and compared to observe and analyze changes taking place below.
Those changes, which can be either disastrous or merely eventful, are helpful in telling the facts of what is happening in a particular area. The best part is that tools that can be used to view those changes can be used by anyone.
Using Satellite Time-Lapse Imagery to Identify Infrastructure Changes in Myanmar
To identify clear signs of the razing of villages and development of new infrastructure, researchers are able to build a time-lapse of satellite imagery using Sentinel Hub’s freely available EO browser.
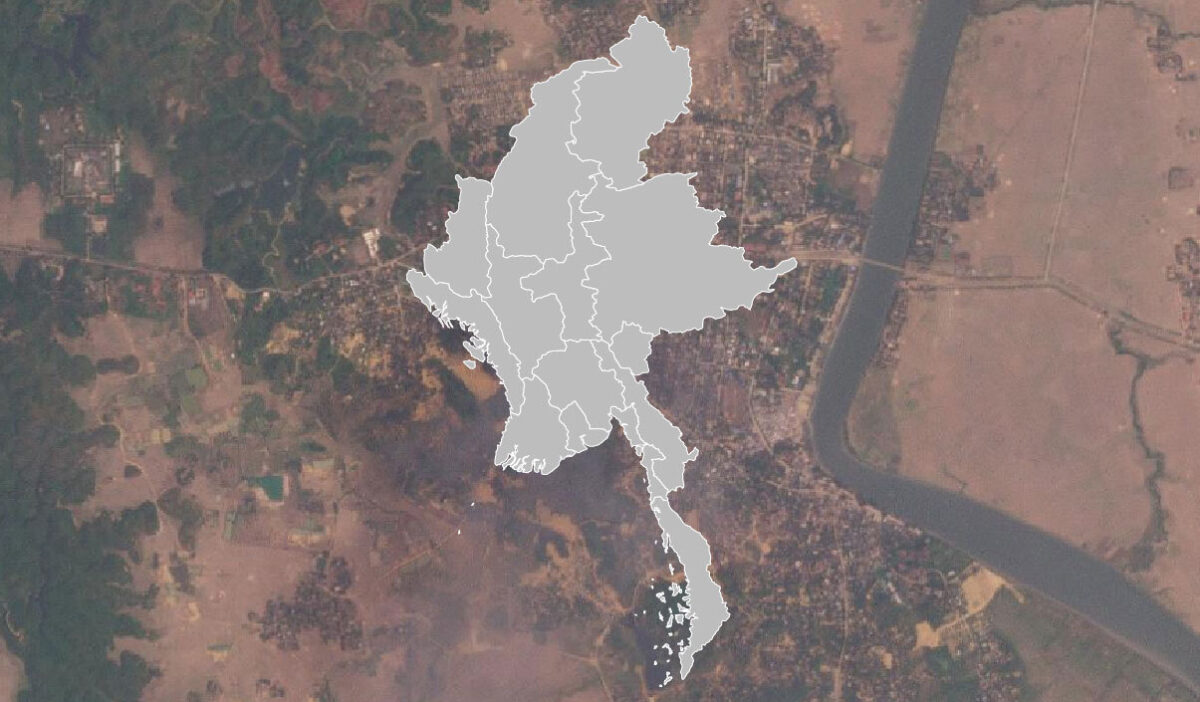
In Myanmar’s Rakhine State, for example, there have been reports of a mass genocide of the Rohingya. Below is a view of an area through Sentinel Hub that experienced significant change between 2017 and 2018 via Copernicus’ Sentinel-2 satellite imagery.
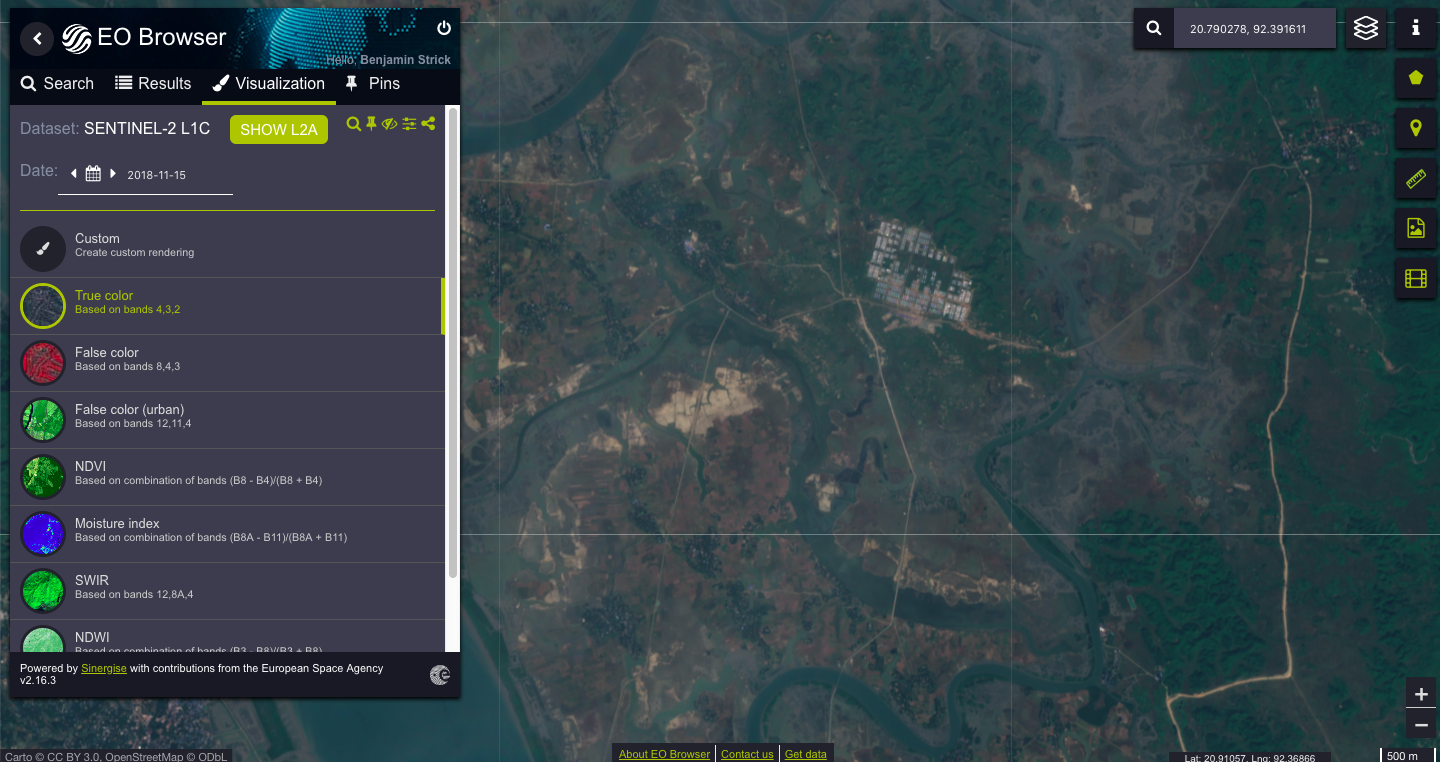
After creating a free account with Sentinel Hub, the function for time-lapse creation becomes available.
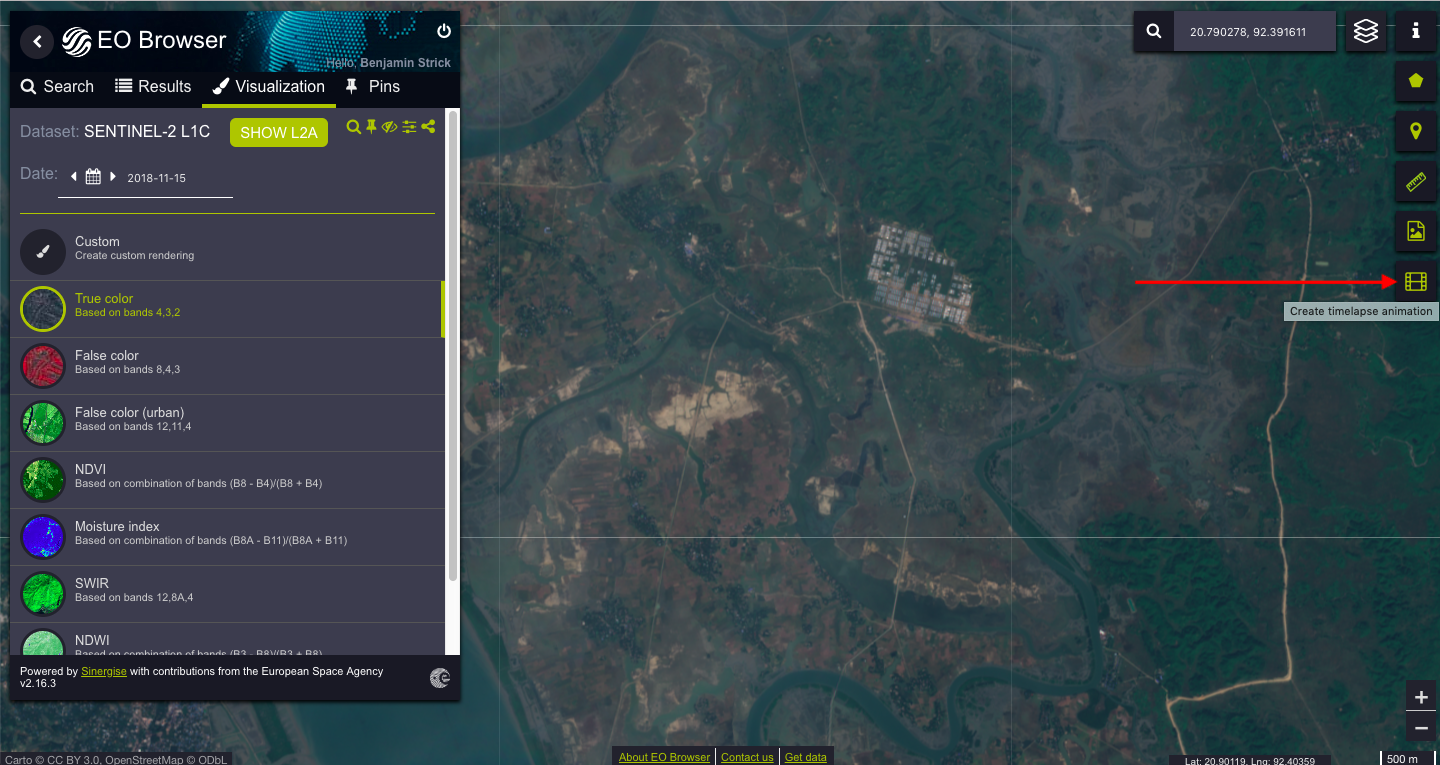
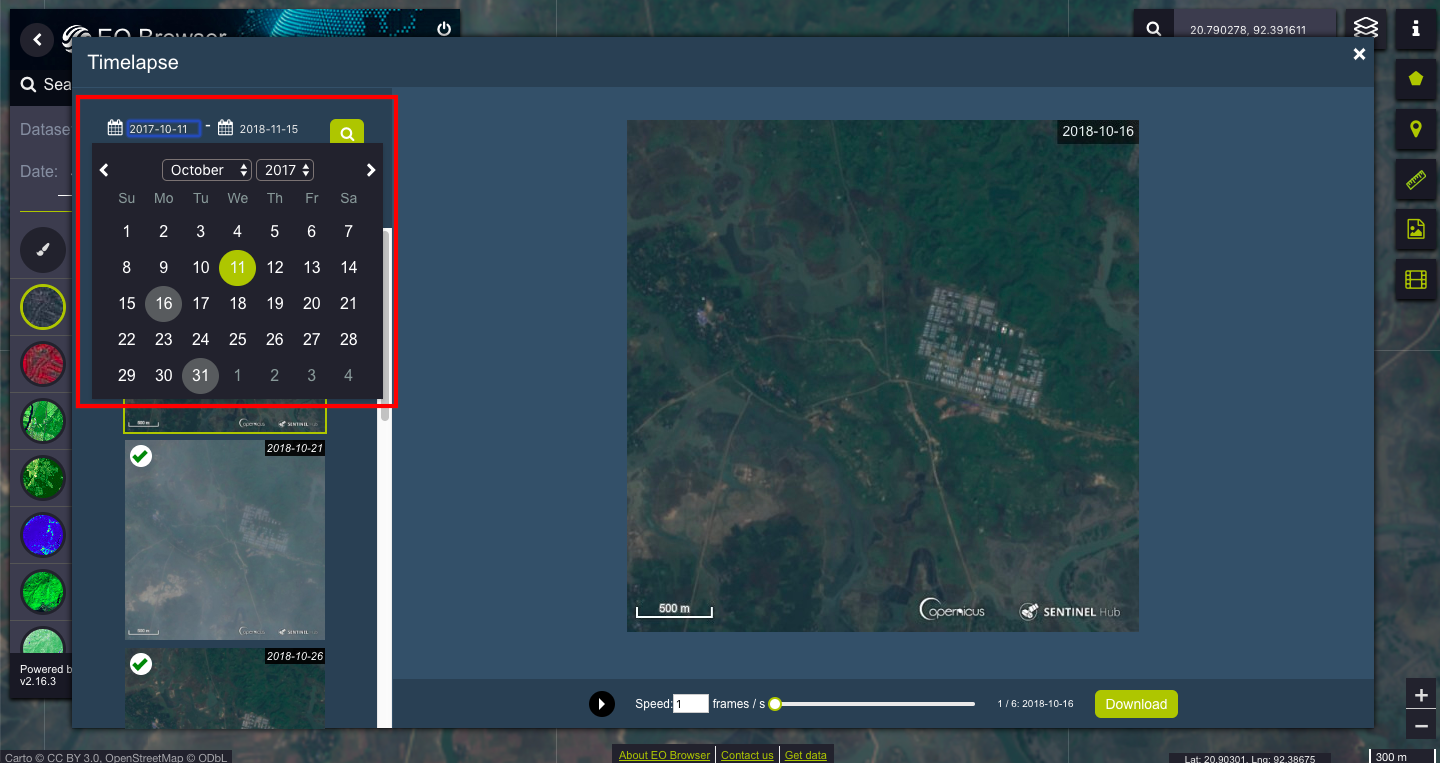
To achieve an effective result for your satellite time-lapse, and to observe change during a set period, select your two dates in the window as seen in the image below.
Knowing that village razing occurred in the Rakhine State between August to December 2017, the selection should capture that particular timeframe.
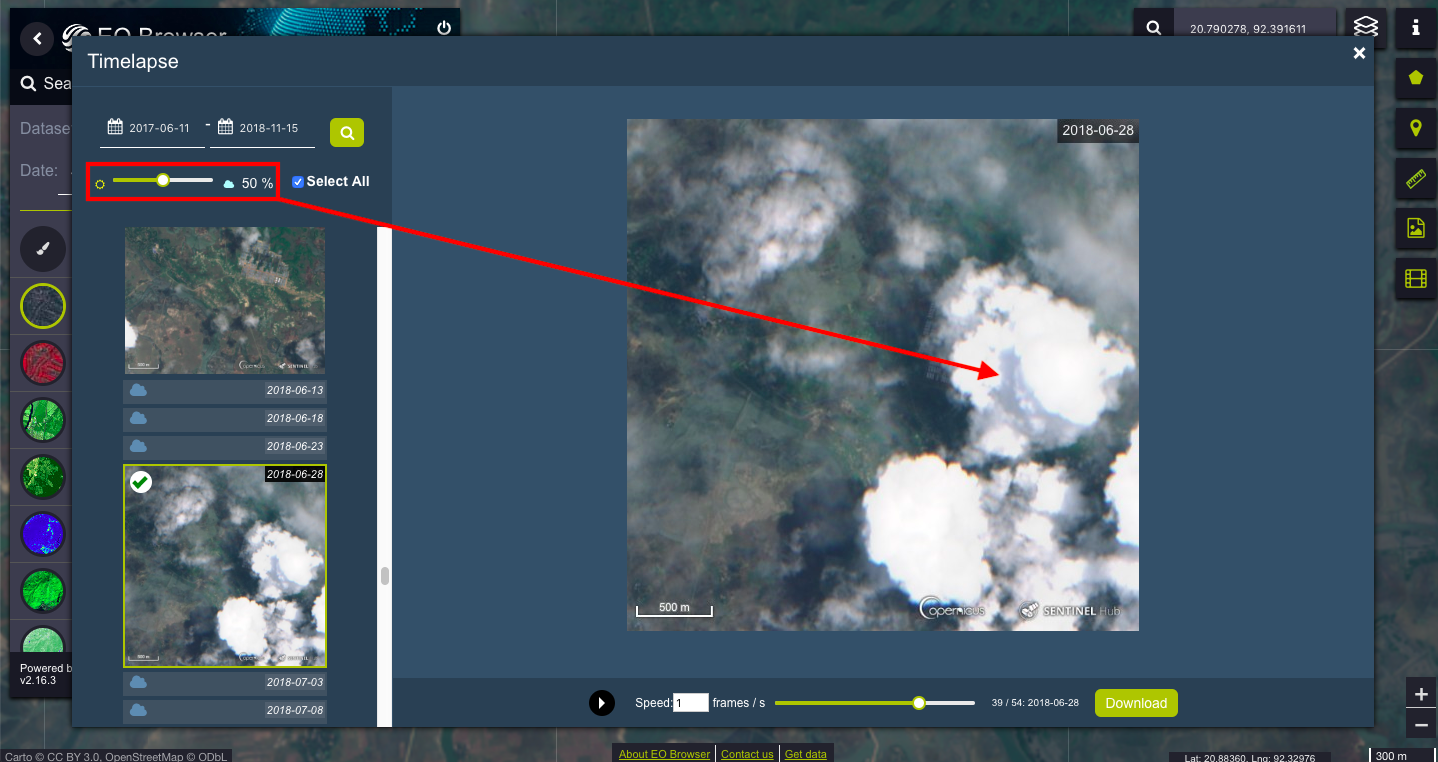
Be mindful of cloud coverage when selecting the date, as satellite imagery with high cloud coverage may hinder visuals. An advisable setting for cloud coverage is either 20% or less.
Having selected the frames to include in the satellite time-lapse, a presentation will be created to play the imagery in a chronological manner.
Speed adjustments at the bottom can be selected for viewing more frames per second.
The final result for this area shows that a village (previously identified as having been burned to the ground) was cleared along with surrounding vegetation and a large camp facility was constructed.
Via this manner of presenting chronological consecutive satellite mapping, we can demonstrate that there is evidence of both the removal of structures and the implementation of new, large-scale facilities.
False colour bands can be utilised to identify other areas of Rakhine State that underwent significant change.
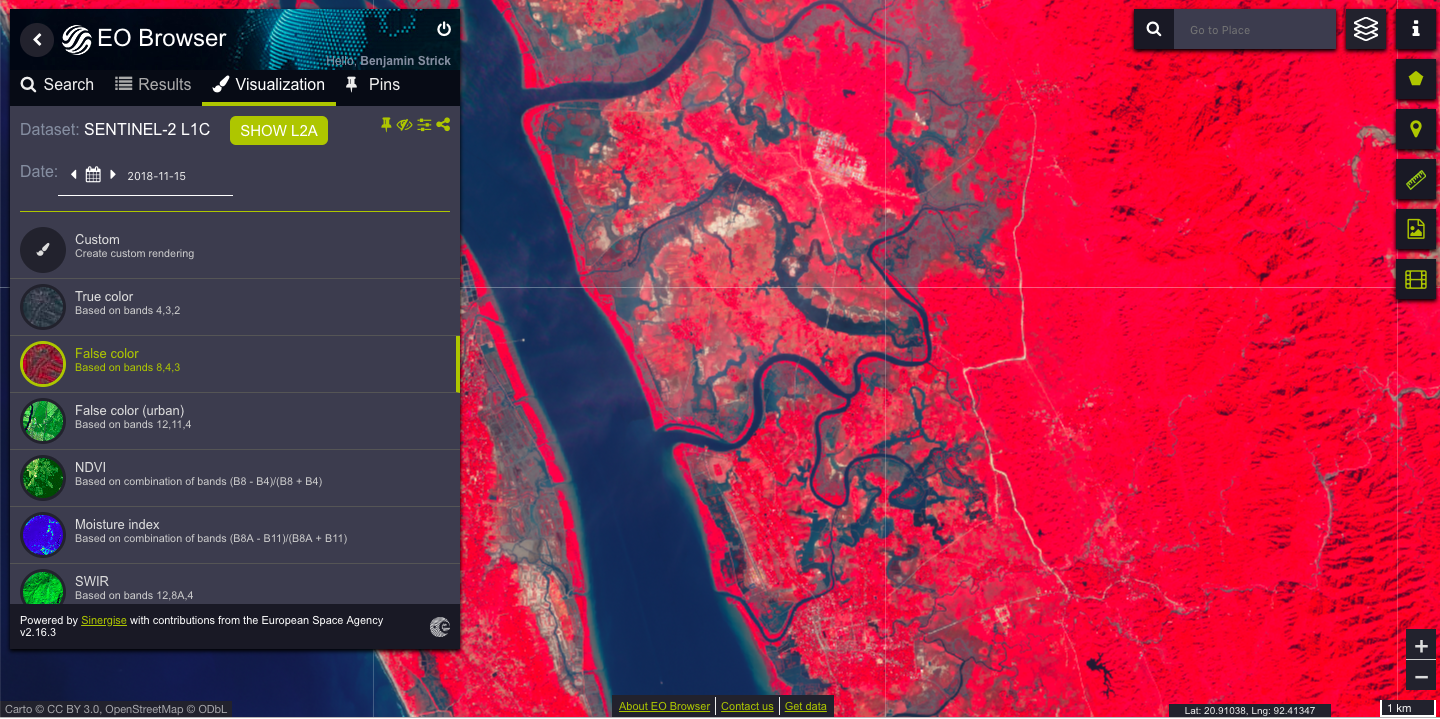
As an overview, sections with significantly lighter colours can be seen to emerge in early 2018. The previous time-lapse, for example, shows the development of the large facility in the north.
A closer view of clearing (below) in the south identifies new infrastructure already in place. The development in the centre of the time-lapse shows what used to be village huts (which were burnt) and is now government buildings. Here is the location on Google Maps.
Adding Сustom Script Banding to Time-Lapse Imagery
With satellite imagery, custom rendering can also be used to manipulate, highlight and affect the way a satellite image is viewed.
For instance, should you require the identification of areas that are experiencing large-scale fires and devastation, custom scripting can be used to highlight active fire locations. This works with the satellite time-lapse of Sentinel Hub, or can be used with GIS packaging such as QGIS.
A selection of custom scripts for varying differentiations can be found on GitHub, and one specific script highlights active fires for Sentinel-2 imagery.
The custom rendering panel can be viewed under “Visualization” (1), and “Custom” (2).
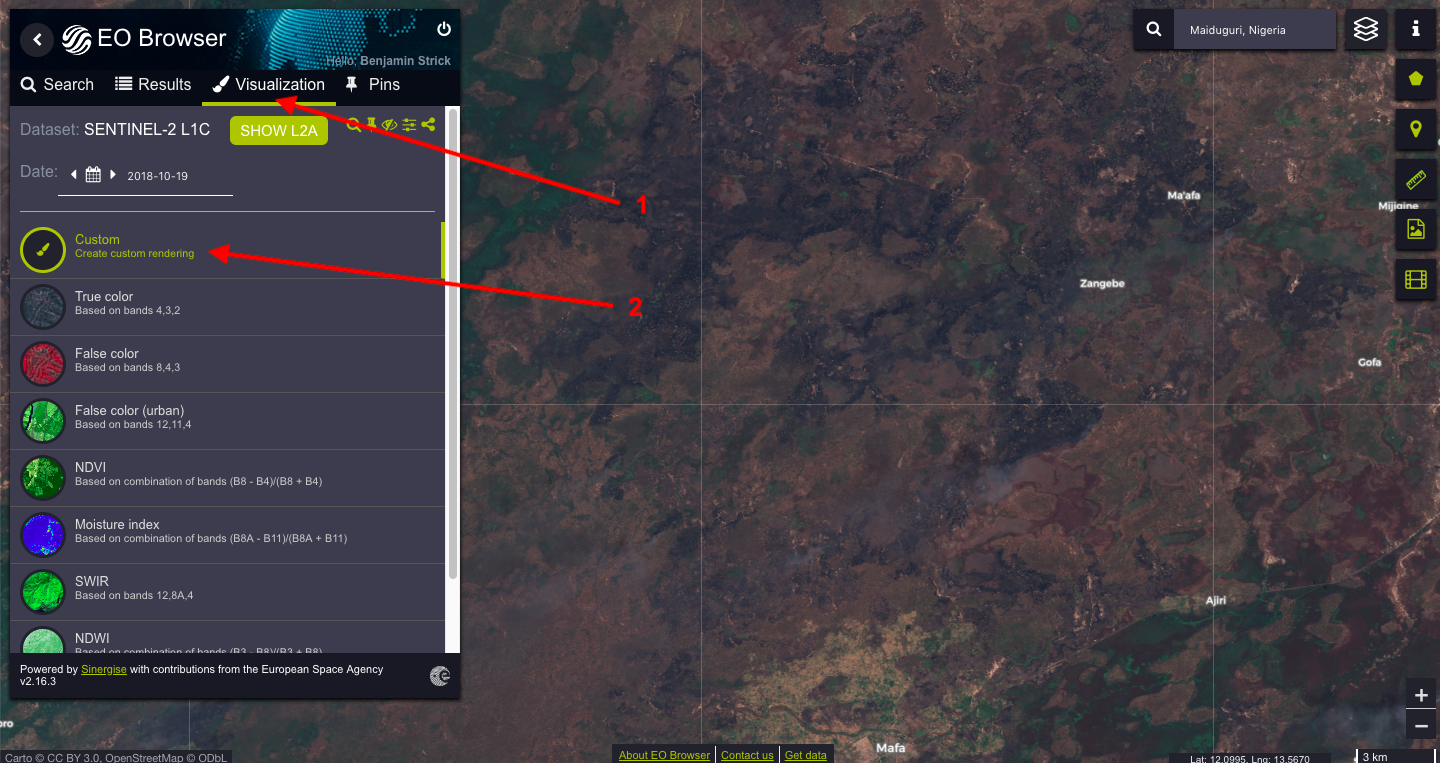
Applying the script has the visual effect of highlighting the intended values.
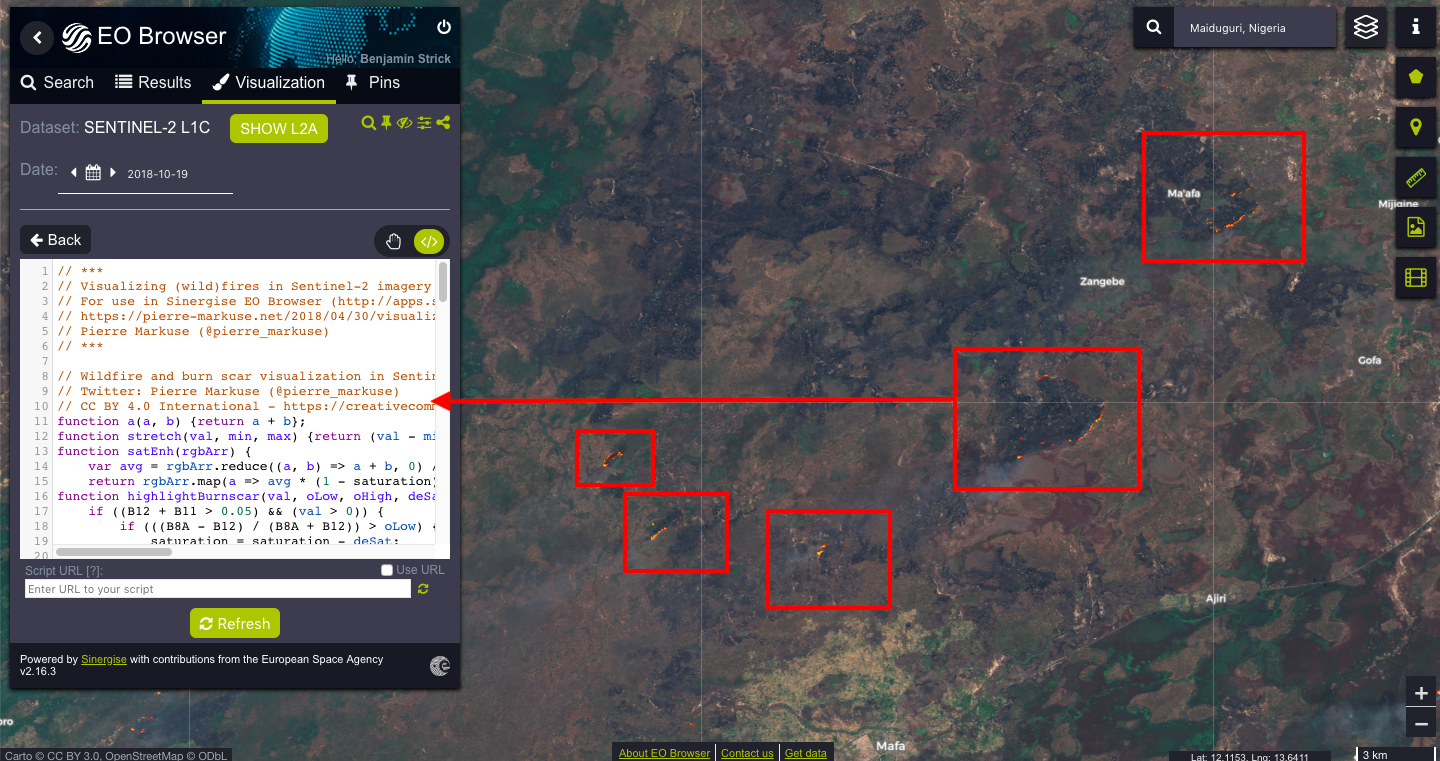
Using this script, in conjunction with the time-lapse function, shows the before, during, and the after-effects of the fire.
Using this type of fire identification works in effect to identify specific dates for when destructive activity may have occurred, which further assists with research.
As an example, in the time-lapse below, here is how the Nigerian village Ngudoram was engulfed by destructive fire.
False Colour Banding in the South China Sea
Repeating the same process in varying satellite banding can produce effective results for monitoring different areas where new infrastructure is identified.
China’s island military expansion in the South China Sea can be evidenced through the manner of time-lapse imagery. Looking at Mischief Reef, which was once a deserted island, and fusing the time-lapse with false colour banding, the island’s new infrastructure can be viewed.
Further scrutiny of satellite imagery, such as using moisture index banding, can be applied. This identifies the level of moisture through the satellite banding.
In this time-lapse above, of Mischief Reef, warmer temperature colours indicate less moisture. The specific areas identified are the tarmac, and one building in the middle of the island — likely to be warm.
Open-Source Remote Sensing Tool Available for Public Use
The ability to view a satellite imagery time-lapse and identify changes taking place on the Earth’s surface is free to use by anyone with a computer and an internet connection.
Using the methods identified in this guide allows anyone to monitor unreachable areas with an analytical approach and identify infrastructure destruction/destructive activities, changes and developments in infrastructure, or anything else, for that matter, on the planet.
Bellingcat’s research for this publication was supported by PAX for Peace.
![]()