Screenshot 2022-02-11 at 16.07.02
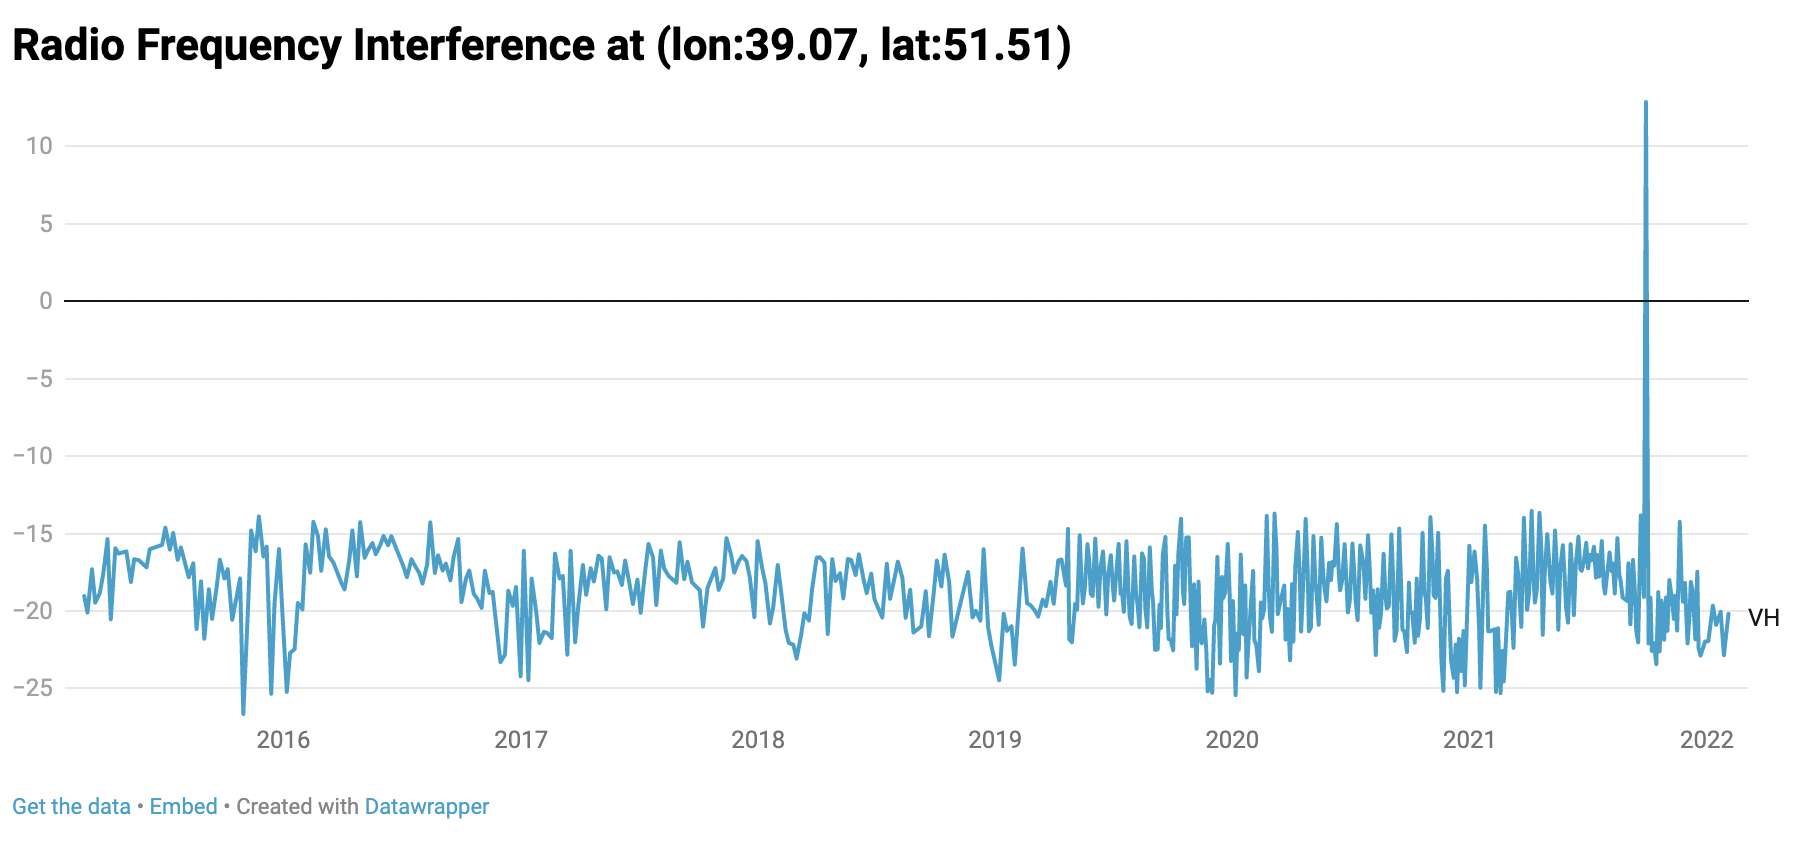
The above graph was generated by clicking on the location indicated above using the RIT tool. It shows the historical strength of the signal returning to Sentinel-1 since 2015 at these coordinates. Though there are some fluctuations, there is a massive spike in the signal on 29 September 2021 which corresponds to the blue RFI stripe in the image above.