Over 500 Days of the Russia-Ukraine Monitor Map
Translations:
Editor’s note: The Eyes on Russia Map is a crowdsourced effort by the Centre for Information Resilience (CIR) and the wider open source community to map, document and verify significant incidents during the conflict in Ukraine. Its aim is to provide reliable information for policymakers, journalists and justice and accountability bodies about the evolving situations both on-the-ground and online. Bellingcat, GeoConfirmed and numerous independent volunteers and organisations in the community have contributed data to the map.
Here, Benjamin Strick of the CIR team details the map and how it can be used.
In January 2022, our team at the Centre for Information Resilience (CIR) launched the Eyes on Russia project to collect, verify and map videos, photos, satellite imagery or other open source media related to Russia’s invasion of Ukraine. The hope was that everyone could have access to reliable, accurate information about Europe’s biggest conflict since the Second World War.
Since then, the Eyes on Russia project has coordinated research by the wider OSI community including Bellingcat, GeoConfirmed and many other organisations and independent volunteers. Each contributes their own open source data about the conflict — several entries from Bellingcat’s Civilian Harm Map can be found among them.
Each organisation brings unique strengths to this collaboration.
CIR manages, sorts and cleans data in a main database that feeds into the map, reviews all entries and collects, analyses and verifies data with a focus on harm or damage to civilians, medical facilities, educational assets, communications infrastructure or energy and utilities infrastructure.
Bellingcat provides the Autoarchiver tool to support archiving of data, and contributes data on where there is an indication of harm to civilians or civilian objects — a trend documented in Bellingcat’s interactive map of civilian harm in Ukraine.
GeoConfirmed collects data from the open source community on Twitter using the @geonconfirmed tag on Twitter.
Geomouse, a group of volunteers that emerged from the Bellingcat Discord channel, focuses on collecting footage of civilian infrastructure damage posted on Telegram.
CIR also accepts data from numerous independent volunteers as well. The map itself was built and is updated by C4ADS.
The map is publicly viewable on both desktop and mobile and as of July 24, 2023, has had over 3.5 million total views. The map contains more than 11,600 videos and images which have been verified and mapped to give an accurate, up to date and detailed view of what is happening in Ukraine. As of this publication, GeoConfirmed has contributed 5455 entries to the map, CIR contributed 4211, and Bellingcat 783. Independent volunteers contributed 725 entries and Geomouse contributed 458 entries.
The verification work is carried out by open source investigators as well as the wider community through geolocation and chronolocation. Once collected from social media, the content is logged in a central database where the material is archived for future use by researchers, reporters as well as justice and accountability bodies.
Before any content makes its way onto the map, it is further reviewed by senior investigators at the CIR to ensure the information is accurate and safe.
We also take mental health and the sharing of graphic material seriously, and part of our core process involves our investigation teams rating content on the map to indicate the level of graphic content. Highly graphic content is not included in preview boxes. This is to serve as both a warning for future researchers of the nature of the footage when being reviewed, as well as for the wider public when dealing with such resources.
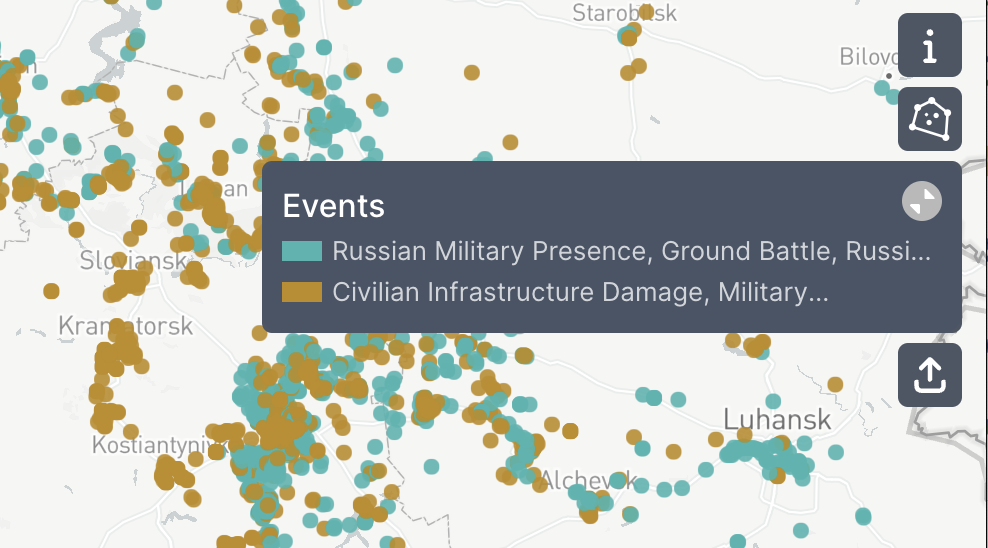
Each piece of information that you see on the map is checked for its content and given a brief description and category (or categories if more than one) so that keywords can be searched to look for specific trends, patterns, or to dive into the verified data.
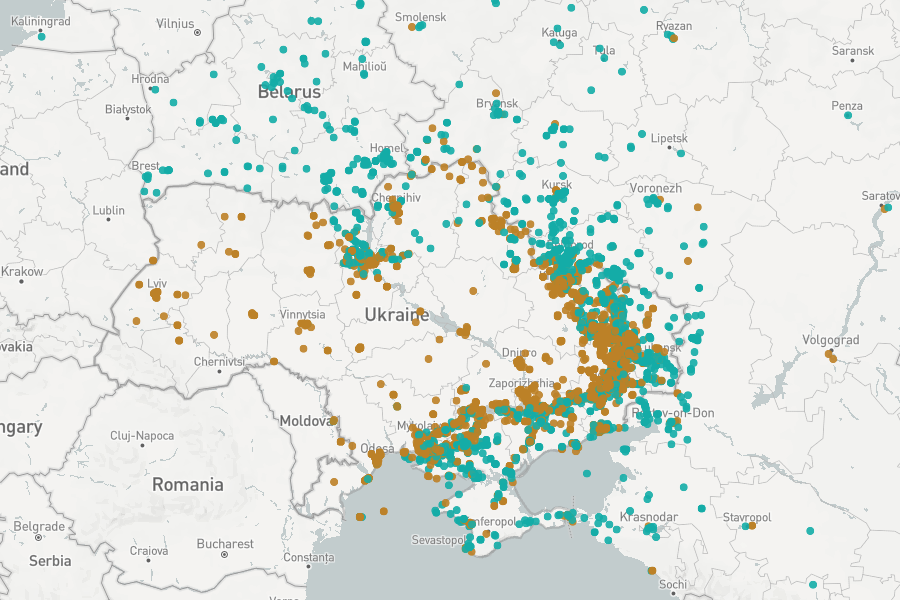
The map therefore displays a large number of different coloured pins. These represent specific categories of open source footage or imagery, the key to which can be found in the right hand column of the map. It must be noted that the categories have changed as Russia’s invasion of Ukraine continues.
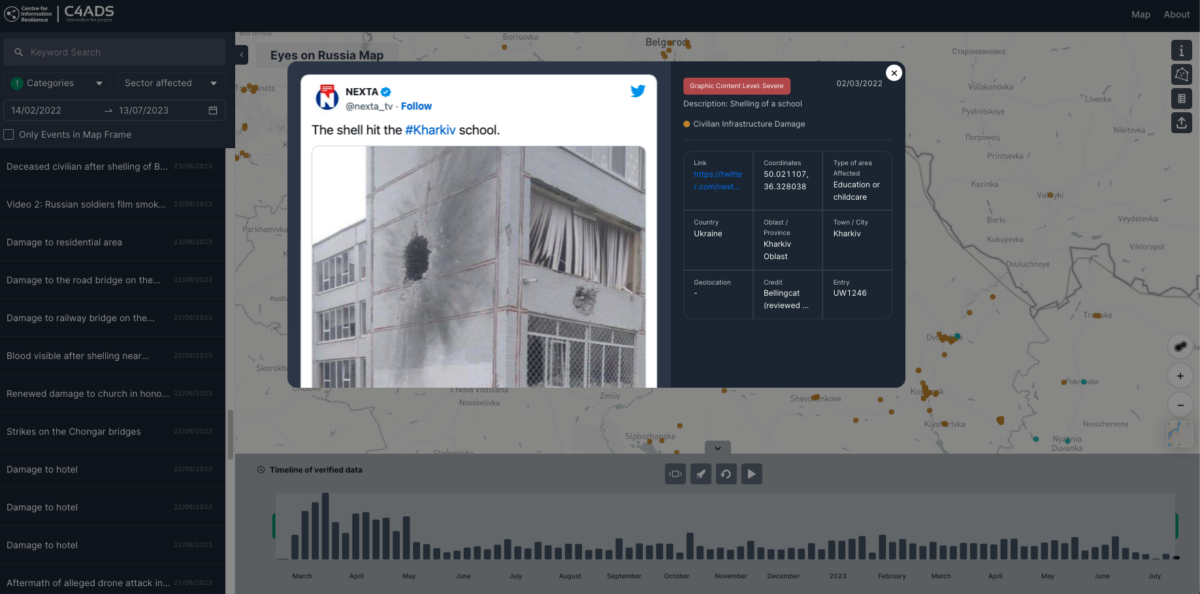
For example, in the image below, an entry in the civilian infrastructure damage category can be seen as verified and geolocated shows damage to a school building in Kharkiv on 2 March, 2022. It can also be found in Bellingcat’s map of civilian harm in Ukraine under the code CIV0159.
The initial map we published at the start of the full-scale invasion was created using MapHub. However, we have since made significant changes to the map in collaboration with C4ADS to increase users’ ability to interact with the data, filter information points and search content through our new custom made map.
For example, where previously our map was only sortable by date, the updated map now allows for data to be viewed in the left panel based on time, category, sub-category, timeframe, location or keyword.
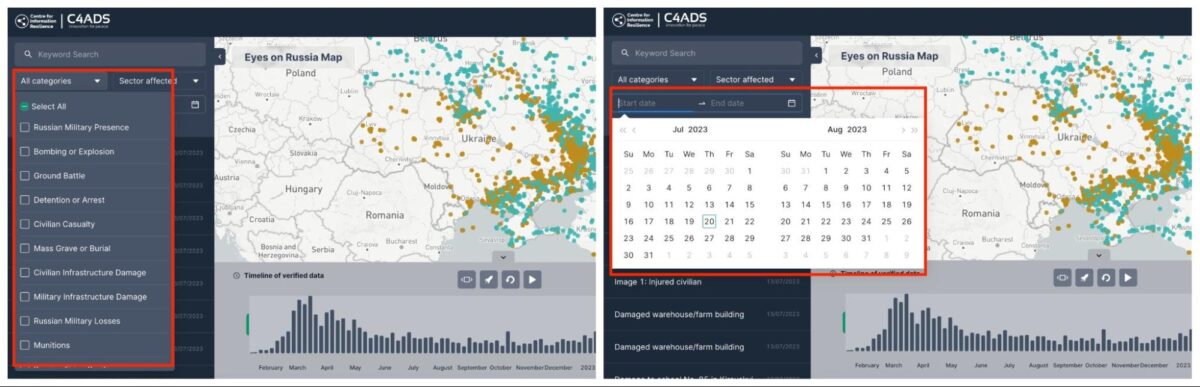
The most used new feature of the map sits at the bottom of the screen. It’s a timeline of verified data from the map, from the first right up to the most recent entry. As you can see below, this timeline can also be played, allowing you to watch the data unfold on the map as the days, weeks and months progress.
You can also use this timeline feature in conjunction with the newly accessible categories and sub-categories. This allows the user to view distinct trends over time, such as the targeting of education, healthcare or industrial infrastructure, or to visualise the spread of Russian military losses over time.
The Eyes on Russia map continues to grow thanks to the input of all its partners and hopefully will continue to be a useful resource for anybody observing this invasion from afar or on the ground. You can find out more about the map’s methodology and origins at our about page.