Radar Interference Tracker: A New Open Source Tool to Locate Active Military Radar Systems
Editor’s note: The Radar Interference Tracker (RIT) is a new tool created by Ollie Ballinger that allows anyone to search for and potentially locate active military radar systems anywhere on earth. Click here to access the tool and read on for a full description of how to use it (as well as learning about the fascinating research it builds upon). The Bellingcat Investigative Tech Team has also published the source code for the RIT tool on it on its Github page.
In 2018, Israeli geospatial engineer Harel Dan made a startling discovery.
When looking through Synthetic Aperture Radar (SAR) imagery captured by the Sentinel-1 satellites, he noticed strong interference patterns over much of the Middle East.
As Dan explained in this blog post, he had intended to filter out the background noise that is commonly picked up by Sentinel-1 but accidentally maximised rather than minimised the settings that capture such interference.
He noticed a strange pattern in the resulting image.
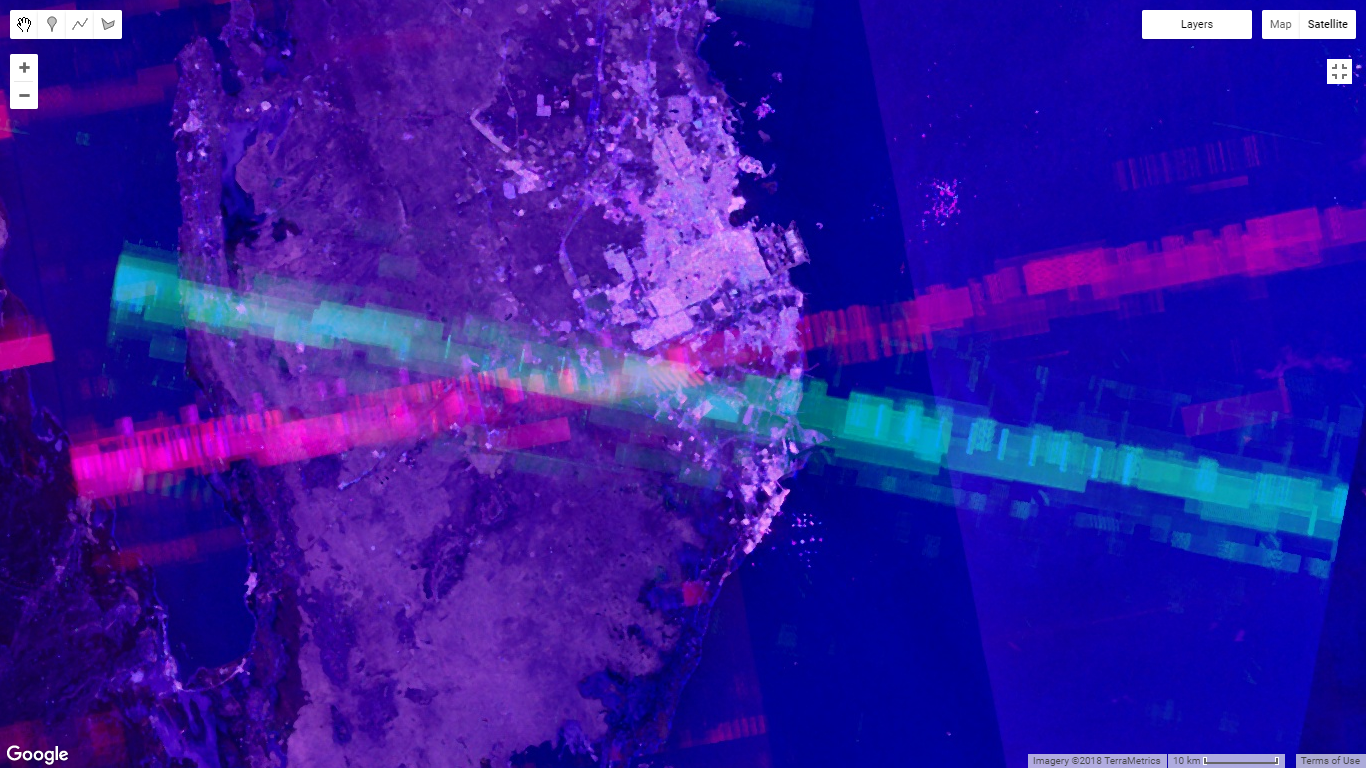
An interference pattern detected by Sentinel-1.
This small error and intriguing picture would come to prove fruitful for open source enthusiasts.
Further research confirmed that much of this interference was being caused by operational missile defence systems, such as the MIM-104 Patriot PAC-2, that were spread across Bahrain, Qatar, Jordan, Israel, Yemen and beyond.
And it was all visible, it transpired, on publicly available satellite imagery.
While most satellite imagery is optical, meaning it captures sunlight reflected by the earth’s surface, Synthetic Aperture Radar (SAR) satellites such as Sentinel-1 work by emitting pulses of radio waves and measuring how much of the signal is reflected back. This is similar to the way a bat uses sonar to “see” in the dark: by emitting calls and listening to echoes.
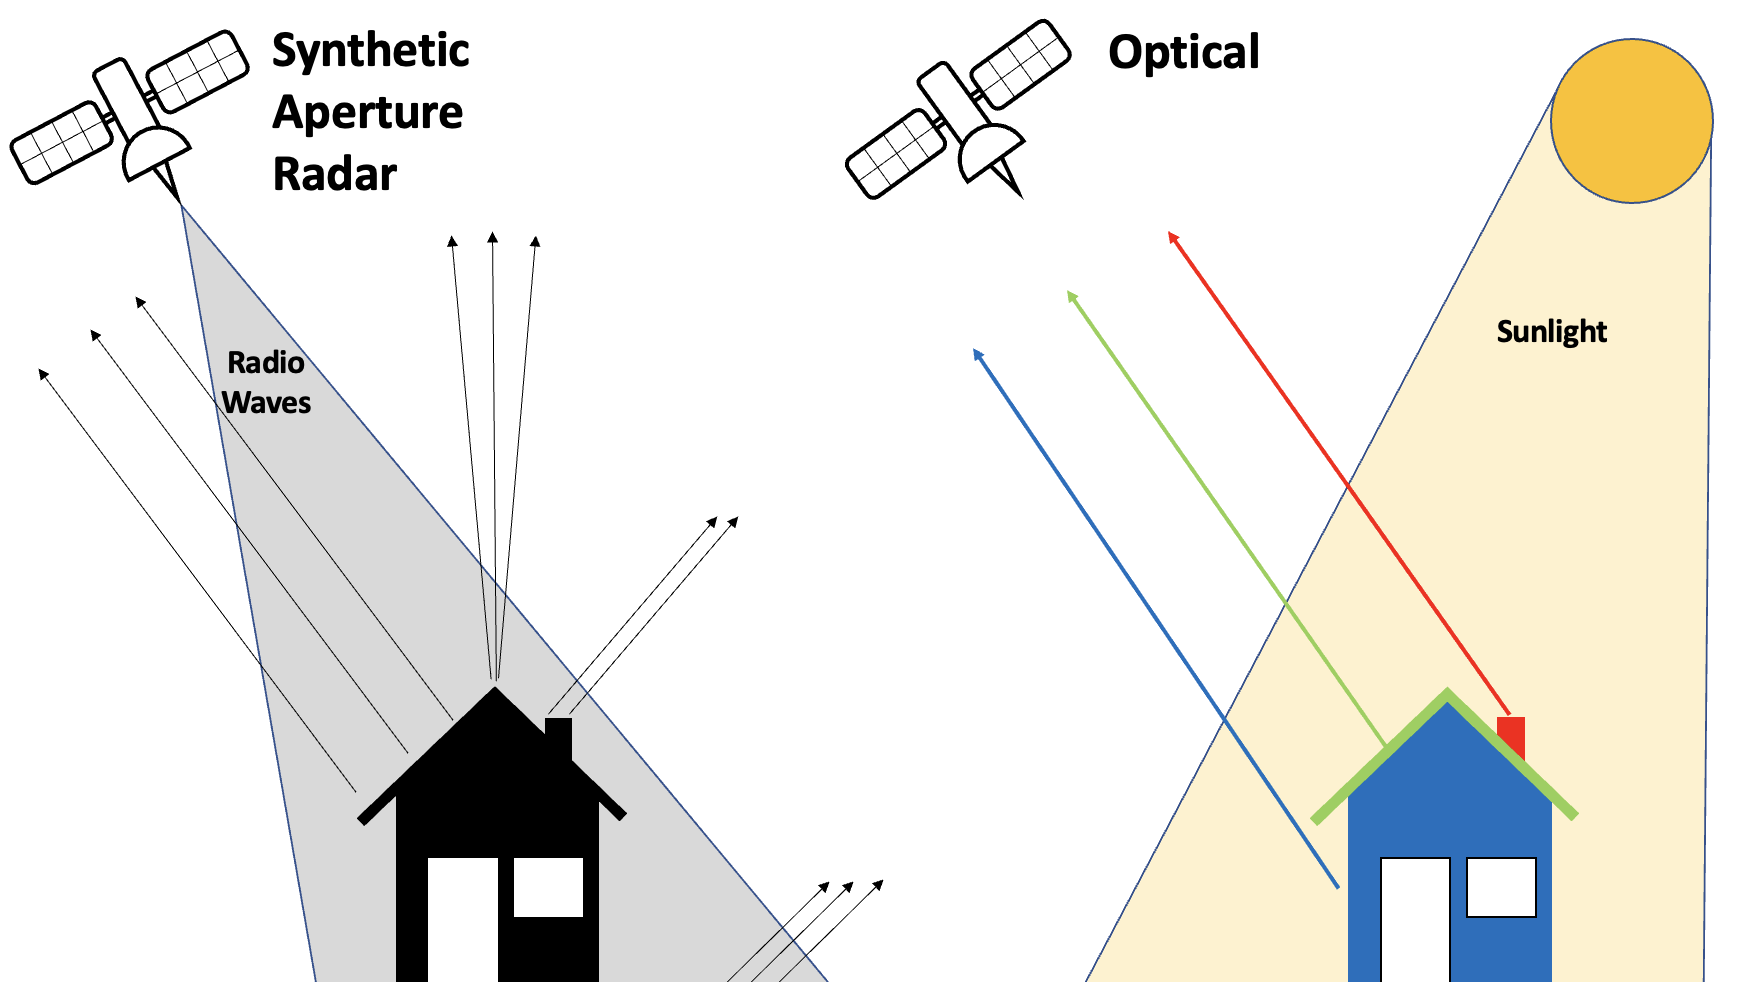
A demonstration of how synthetic aperture radar works. Image ©: Ollie Ballinger
Coincidentally, the radars on some missile defence batteries and other military radars operate using frequencies in the NATO G-band (4,000 to 6,000 Megahertz) which overlaps with the civilian C-band (4,000, to 8,000 Megahertz), commonly used by open source SAR satellites.
In the simplest terms, this means that when the radar on the likes of a Patriot battery is turned on, Sentinel-1 picks up both the echo from its own pulse of radio waves, as well as a powerful blast of radio waves from the ground-based radar. This shows up as a stripe of interference perpendicular to the orbital path of the satellite.
How can Sentinel-1 Spot Active Military Radars?
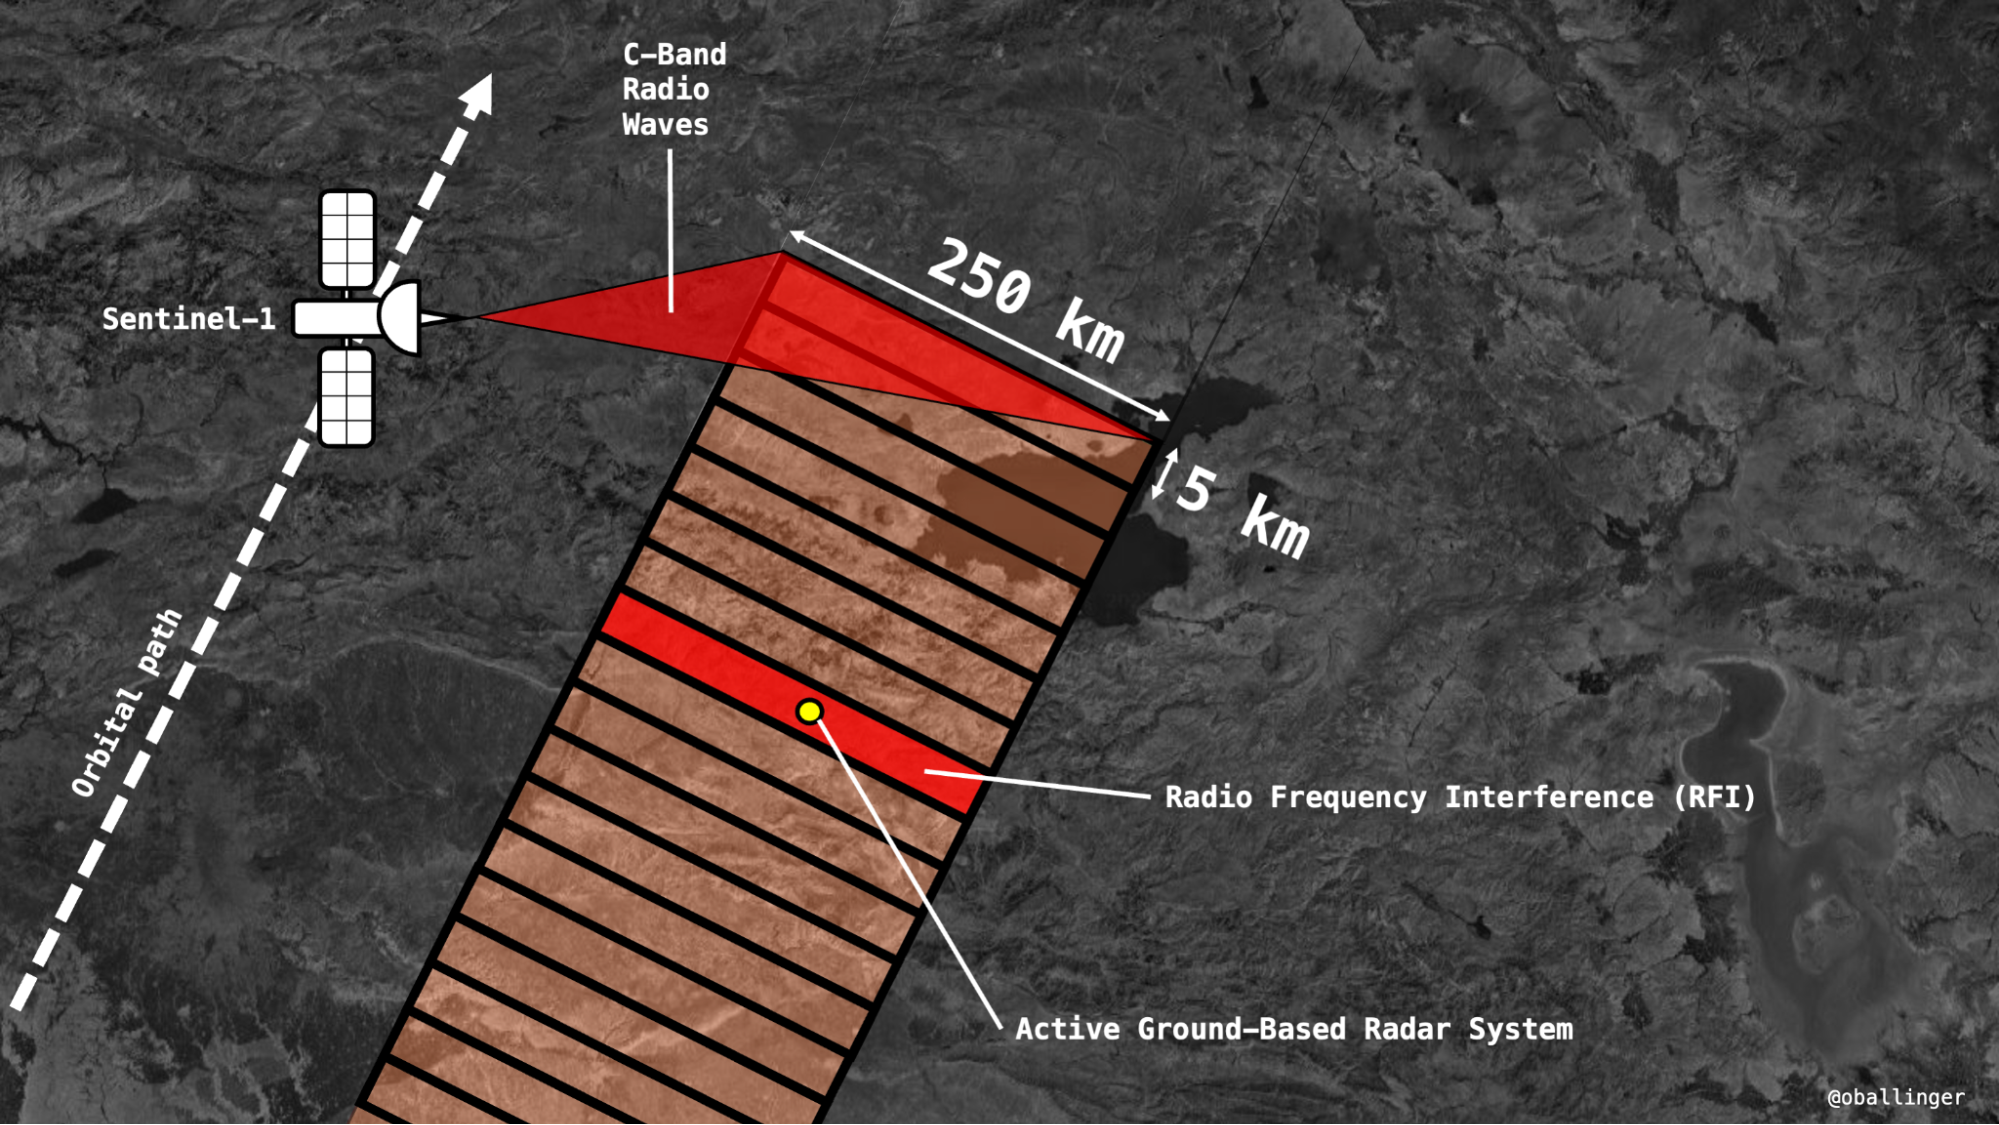
Sentinel-1 works by illuminating a 250 kilometre (km) long and 5 km wide swath of land below the satellite with a pulse of C-band radio waves. If a powerful ground-based radar creates interference, the entire 250-by-5 km swath in which it is located will be affected, creating a bright stripe in the image.
Combining imagery from the two Sentinel-1 satellites (the constellation is comprised of two satellites) taken from different angles, the interference lines cross to form a distinctive “X-like” feature, considerably narrowing down the search area.
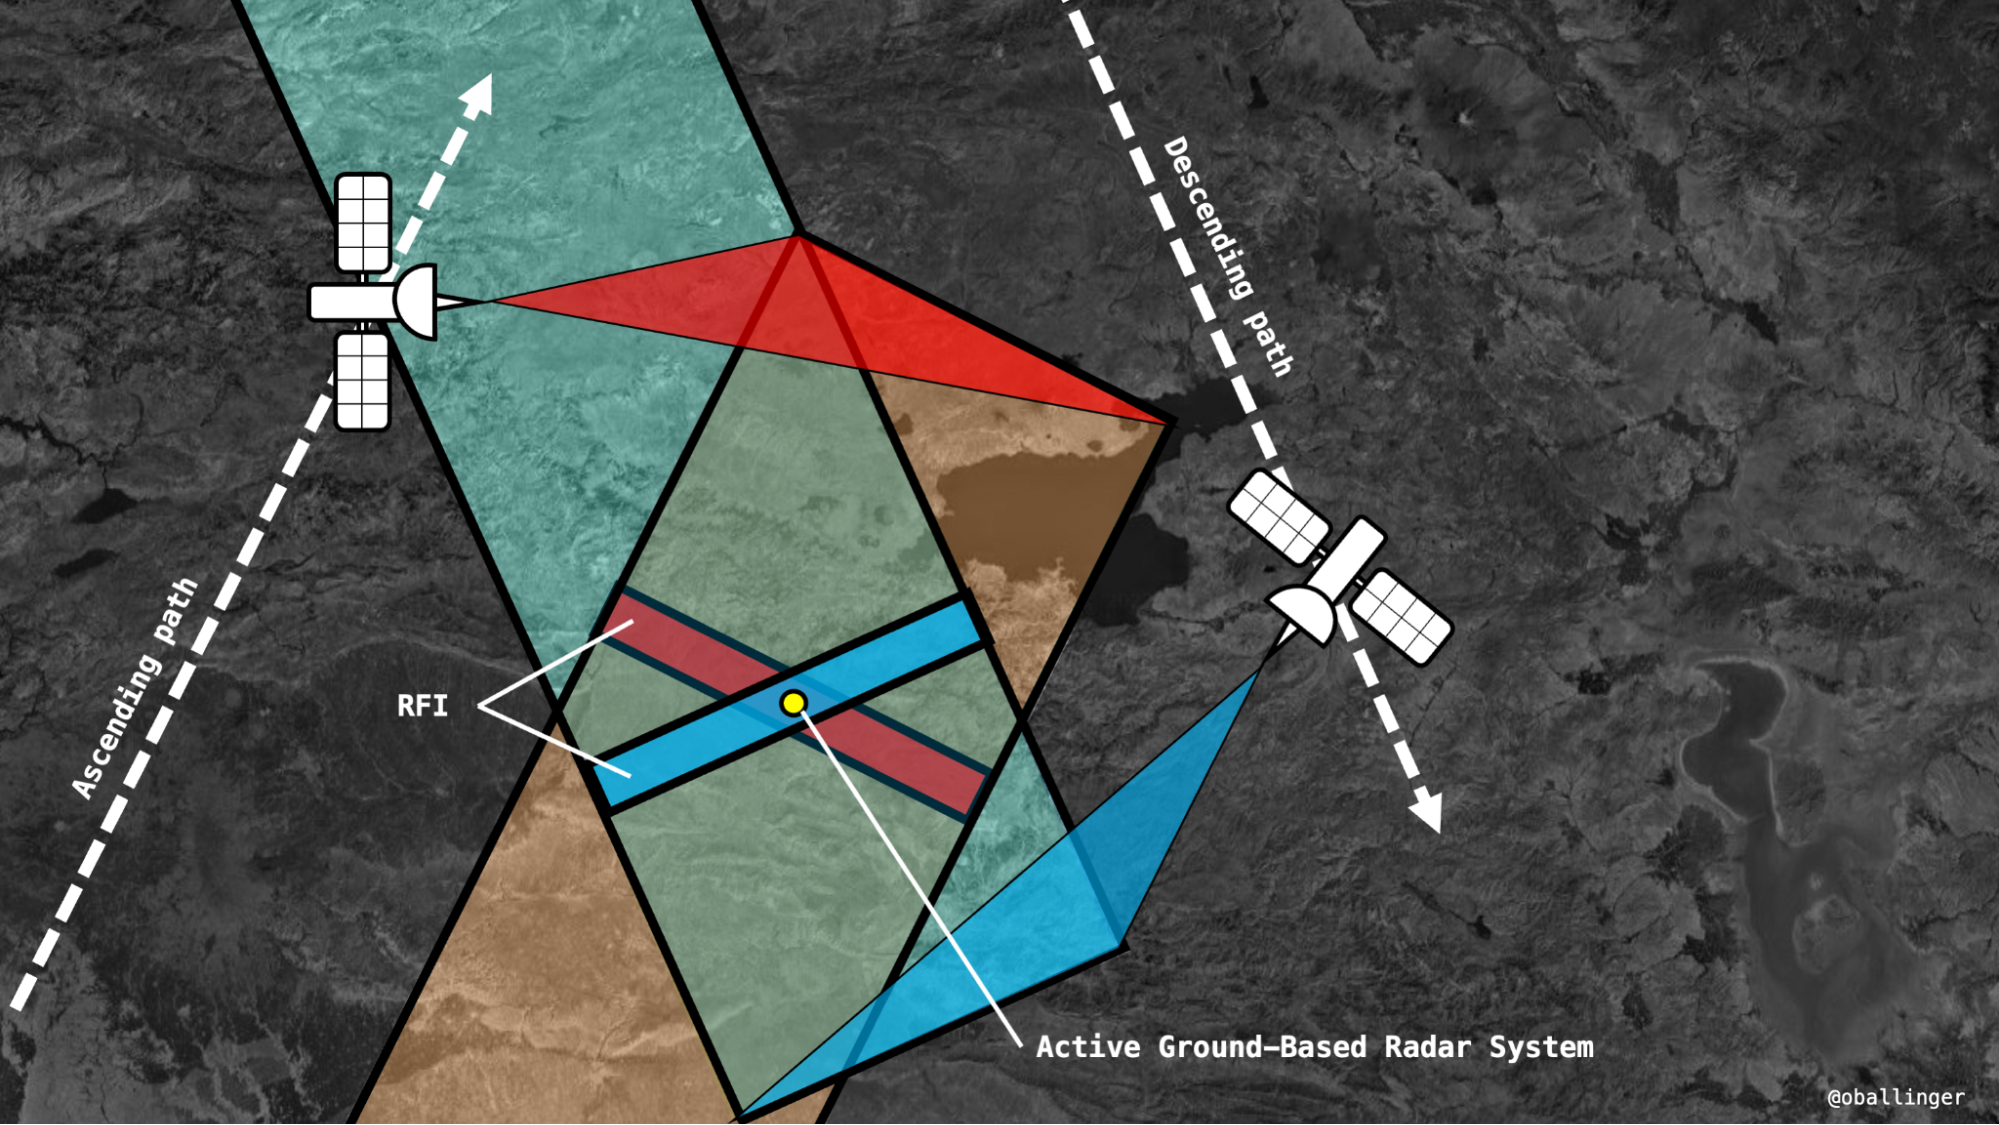
In the diagram above, the ascending satellite registers Radio Frequency Interference in one of the 250 km by 5 km swaths it imaged, creating a bright red stripe. Later, the descending satellite also registers RFI in a swath, which becomes bright blue. By stacking these images together (over a month or a year), we can find the source of the RFI where they intersect. Sometimes a radar is only switched on for a short period of time, and interference is only captured at one angle. This broadens the search area, but the process of locating the radar by looking at the area under the signal remains the same.
Patriot missiles are not the only system that create this type of interference. Other military radars that operate on the same C-band frequency include naval radars such as the Japanese FCS-3, the Chinese Type-381 and the Russian S-400 surface-to-air missile system. All should be detectable when switched on and in view of Sentinel-1.
Dan confirmed the site of the radars he discovered during his initial research by using other open sources such as imagery on Google Maps and even data from the Strava running app.
He also highlighted other interesting missile battery locations, such as the Swedish STRIL array which acts as the country’s early warning system against Russian aircraft and missiles.
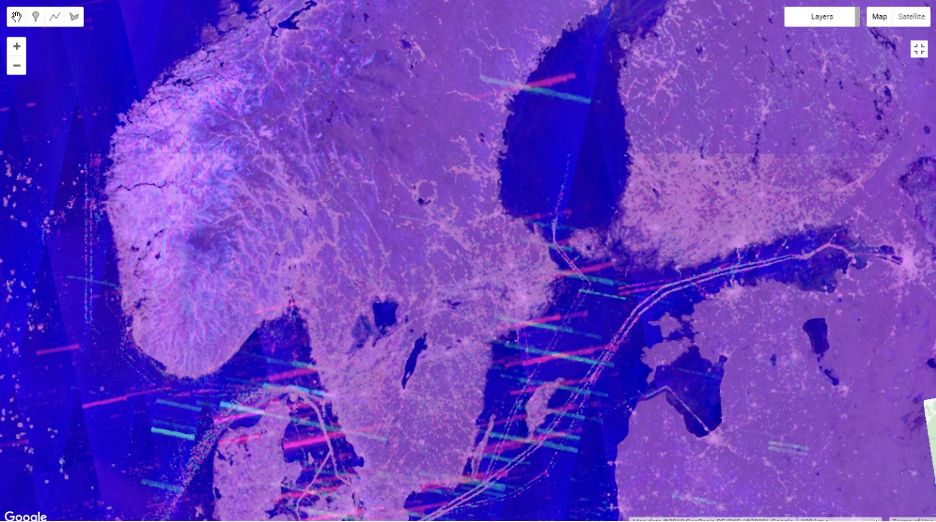
The the Swedish STRIL array captured by Sentinel-1 imagery.
But what if it was possible to look back in time to analyse the potential placement of missile defence systems and other military radars at significant moments, gathering all the relevant Sentinel-1 data across several years and making it easily searchable?
The entire earth is a big area to cover and Sentinel-1 takes in a lot of SAR data that would be time consuming to sift through.
Building on Harel Dan’s initial work and discovery, I have built a tool called the Radar Interference Tracker (RIT) that allows anyone to easily search for Radio Frequency Interference (RFI) from military radars over huge areas and wide time scales.
Yearly aggregates of C-band interference can also be easily calculated and displayed over big areas of interest in a simple and easy to understand manner. If a radar is switched on while Sentinel-1 is overhead just once in a given year, the tool will pick it up and display the interference stripe. With one click, users can then see whether the radar was turned on at any other point in the past seven years by generating a graph of RFI at that location (as detailed in the below image of a site in Dammam, Saudi Arabia).
This effectively allows anyone with an internet connection to track when and where certain military radar systems are being deployed.
You can access the tool here and its source code here, while a complete guide to using the tool is detailed later in this article.
The RIT tool has already proven useful in providing clues about potential troop and equipment movement in western Russia where a huge build up of forces has taken place as the prospect of a war with neighbouring Ukraine has become a distinct possibility.
For example, in September last year the RIT detected what appear to be two strong signals near the Russian towns of Pogonovo and Liski.
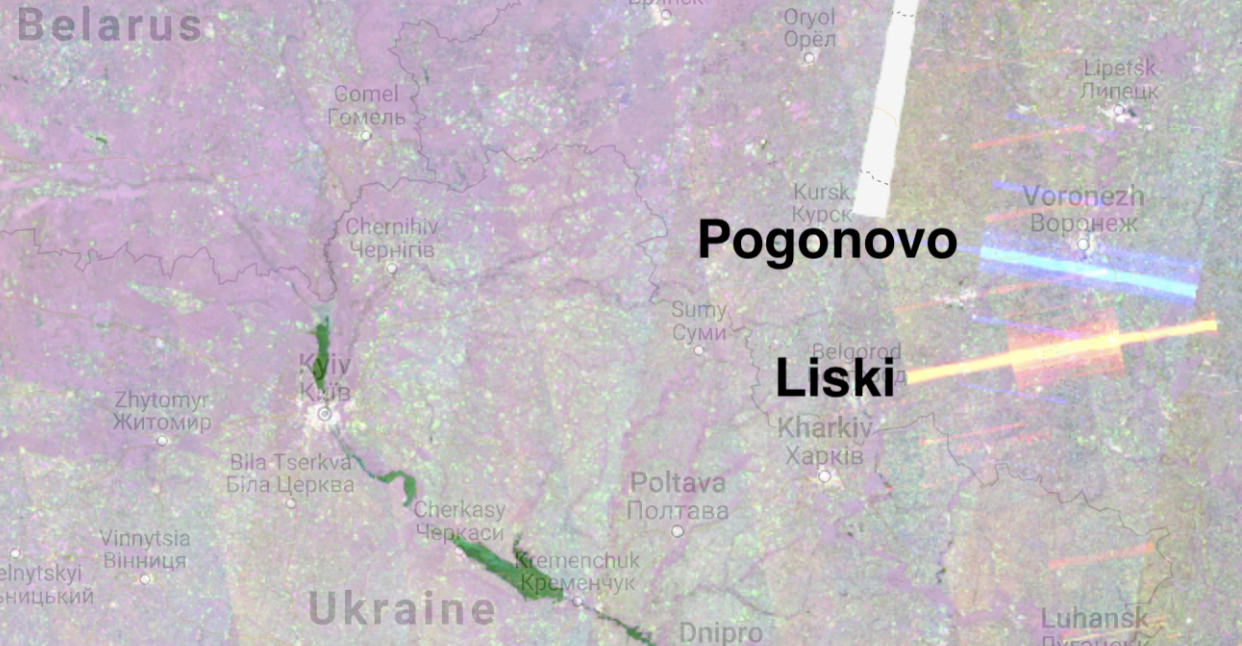
The RIT tool detects interference near Russia’s border with Ukraine in 2021.
There was no signal recorded at these locations at any time through 2019 and 2020. However, in late 2021, as Russian military forces began to move towards the country’s western frontier, these impressions appeared.
Several articles have noted a military buildup at Pogonovo. However, none of these reports indicate the presence of radar systems, and despite reports that Russia was moving military hardware away from Pogonovo in late July, interference was detected on 29 September 2021.
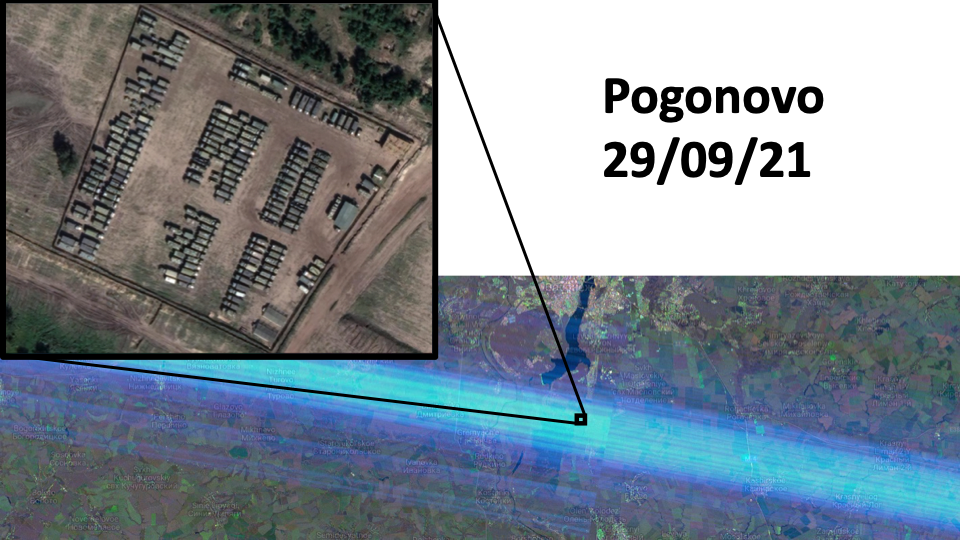
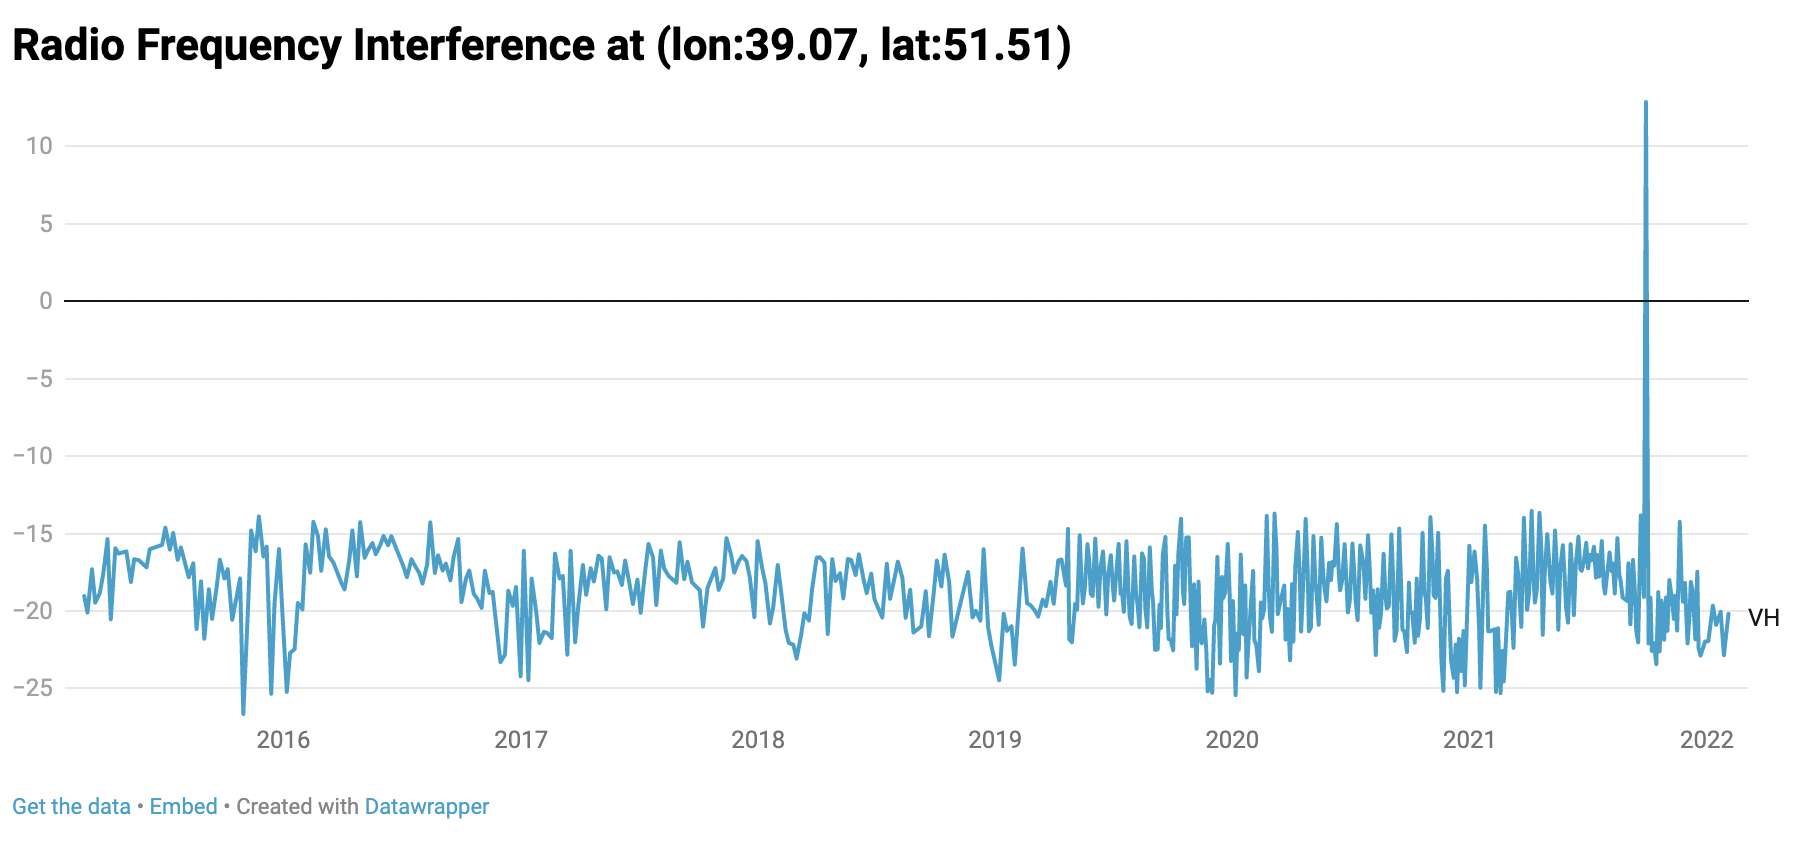
The above graph was generated by clicking on the location indicated above using the RIT tool. It shows the historical strength of the signal returning to Sentinel-1 since 2015 at these coordinates. Though there are some fluctuations, there is a massive spike in the signal on 29 September 2021 which corresponds to the blue RFI stripe in the image above. (Top source: Google Maps. Source bottom: Ollie Balliinger).
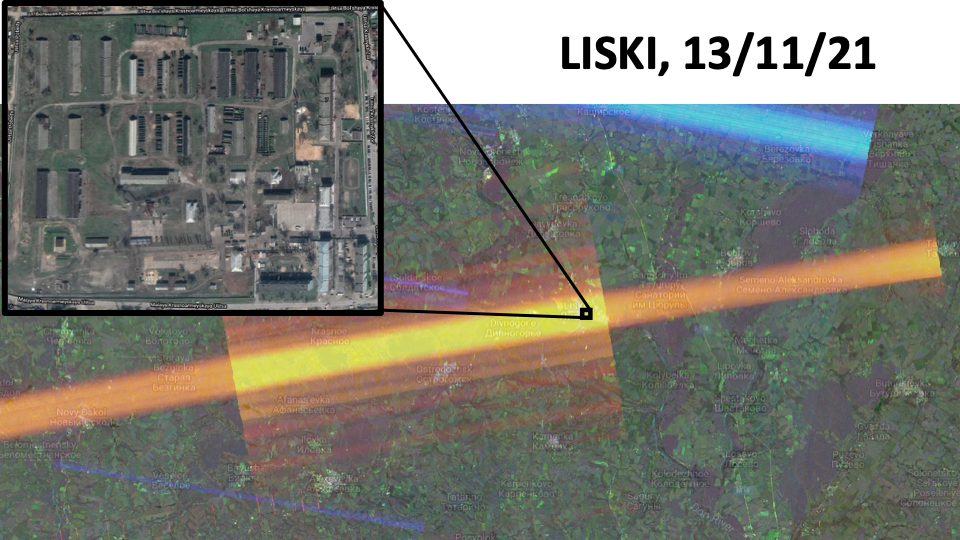
Liski, meanwhile, is home to a military base, although there have as yet been no major media reports of troop build up in this area.
Could this signal show that it is an area worth looking into for researchers and analysts?
This is one of the key benefits of the RIT tool.
While commercially-obtained, high-resolution satellite imagery has been utilised by many journalists and observers to monitor the buildup of Russian troops on its western frontier, this can be a time-consuming process.
Researchers first have to figure out where to look and where to point a satellite. They then have to comb through each image they gather looking for visual evidence with the naked eye. Access to such imagery is also often behind a paywall.
The beauty of identifying radar signals such as those detailed above is that it allows a wide net to be cast before focusing in on areas of interest. Naturally, not all troop build ups or areas of interest will be given away by the signal from a military radar system.
But some may be. As noted in this piece in Forbes last year, the 2014 conflict in eastern Ukraine saw at least one SNAR-10M1 (radar system) help focus artillery fire during the conflict. Mobile air defence systems equipped with radars are also often present in combat zones to protect forward deployed troops; Russia sent several S-400 surface-to-air missile (SAM) systems to Syria in 2015 following the downing of a Russian jet.
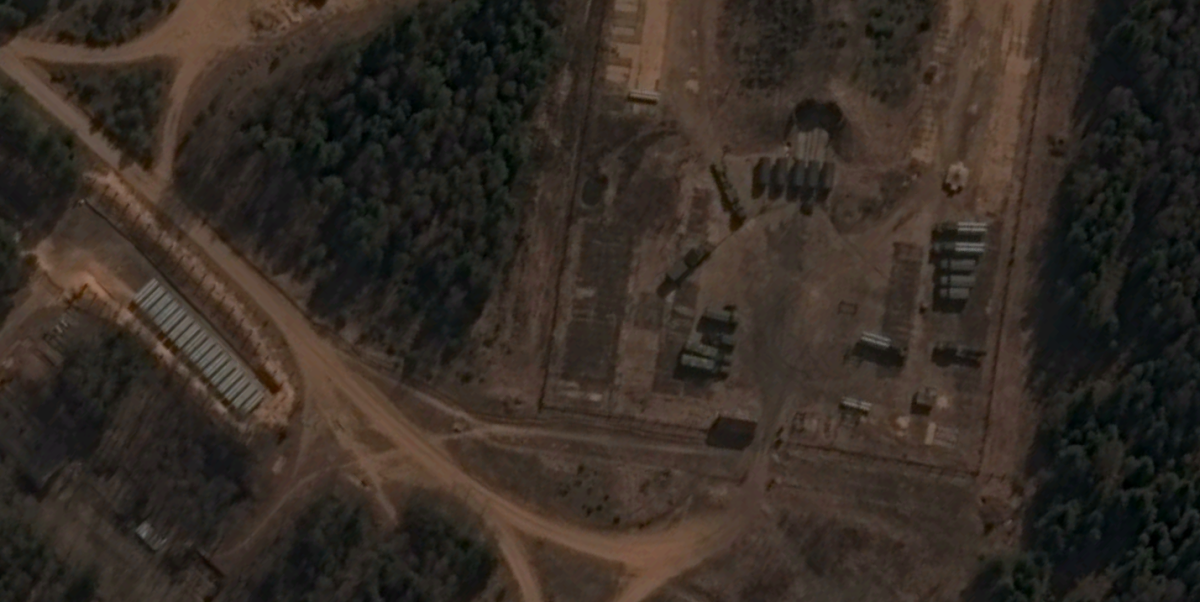
Another interesting signal captured by the RIT tool in western Russia in recent months was seen in the city of Rostov-on-Don, located roughly 70km from the Ukrainian border. Scanning the area under the signal using high resolution imagery from Google Maps (as depicted in the image below) reveals a radio communications institute as being a potential source, with the rest of the area appearing to play host to little more than farmland and several small towns.
Although the RIT tool can help hone in on areas of interest, a manual search of what is underneath a signal is required to identify candidates of the interference. A GIF further demonstrating how the source of a signal can be localised using the RIT tool can be found later on in this article.
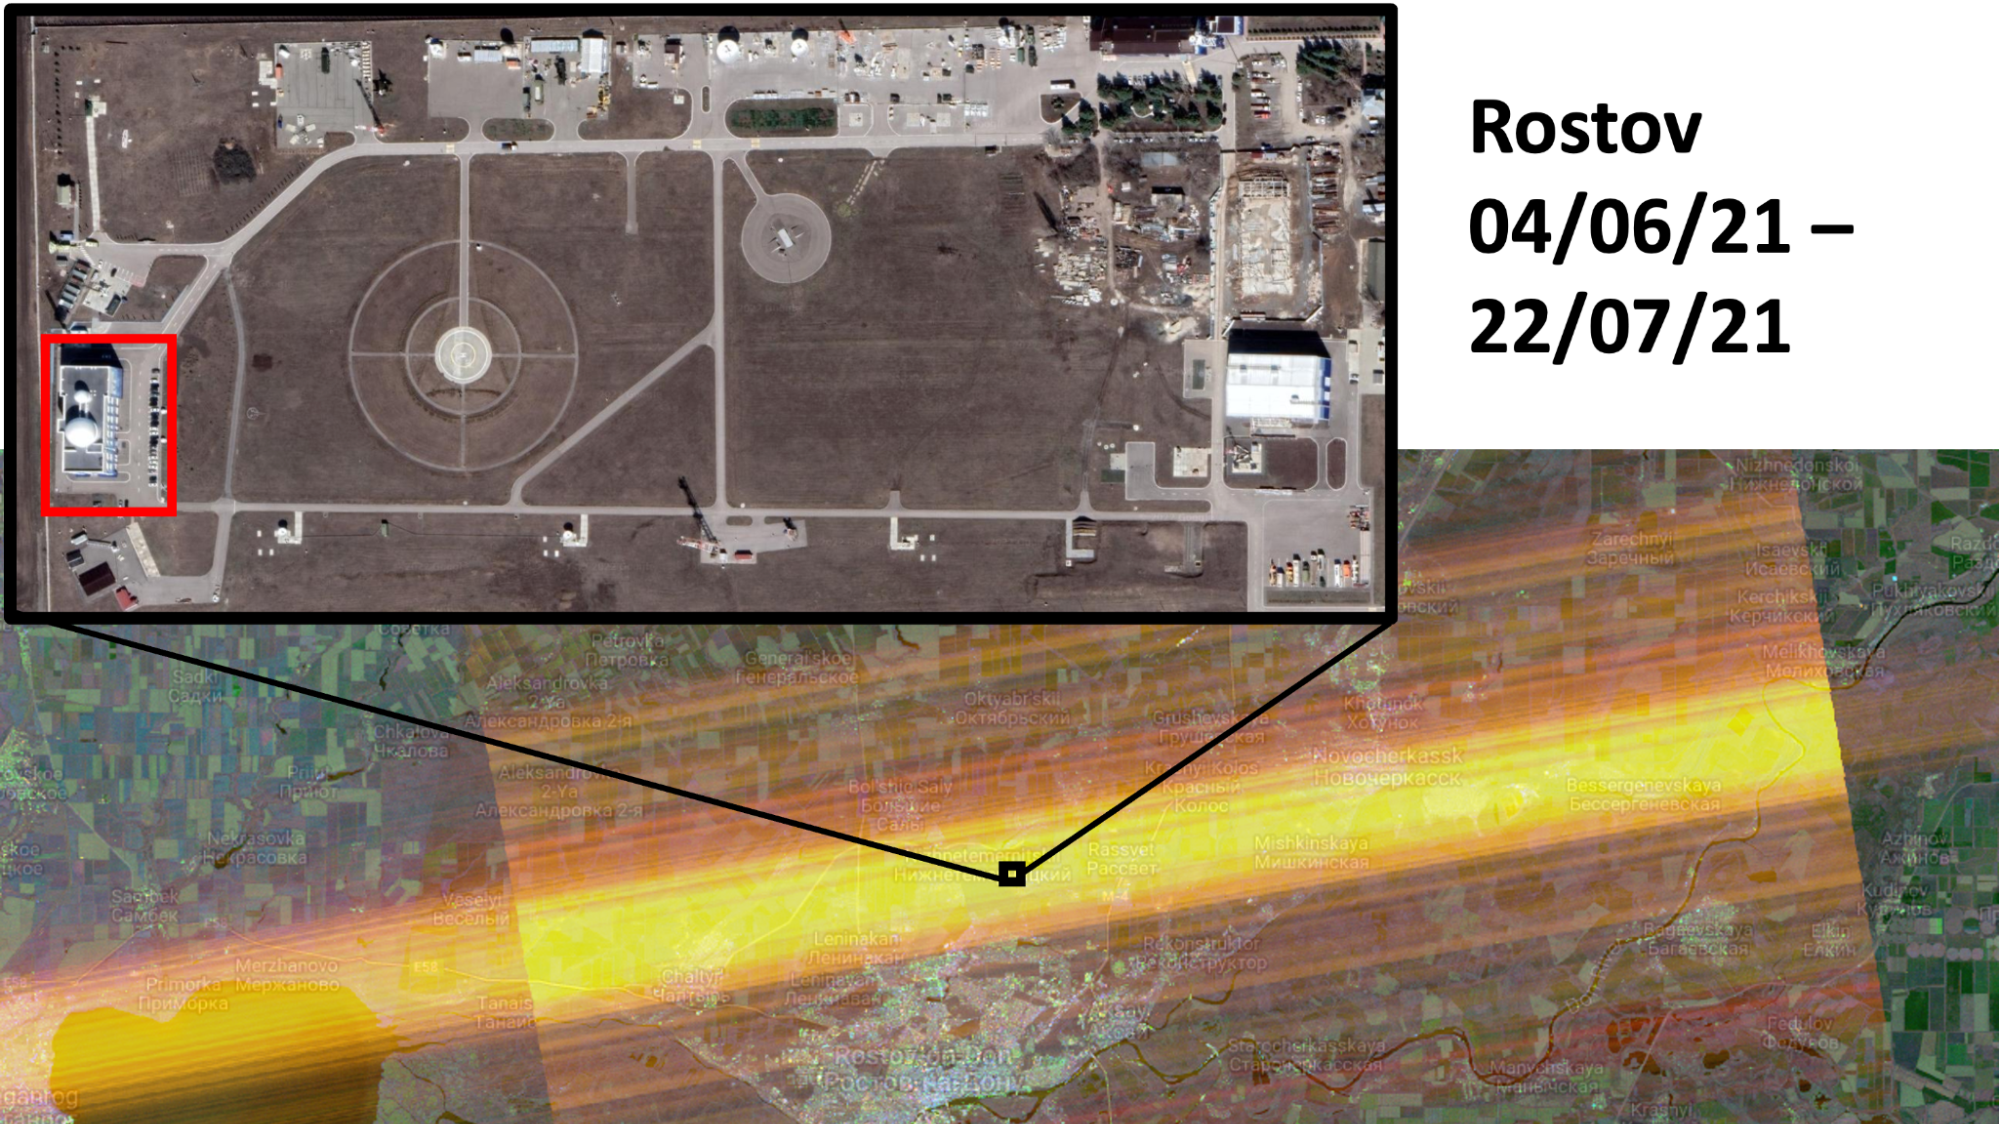
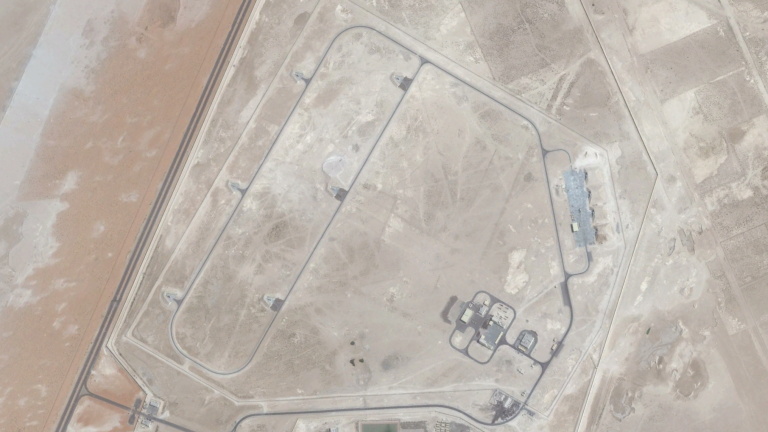
While Rostov-on-Don has seen a significant military buildup and hosts the headquarters of Russia’s 4th Air and Air Defense Forces Command, Google Maps and Street View show a radome — a large structure resembling a giant golf ball that encloses a radar system — underneath the signal.
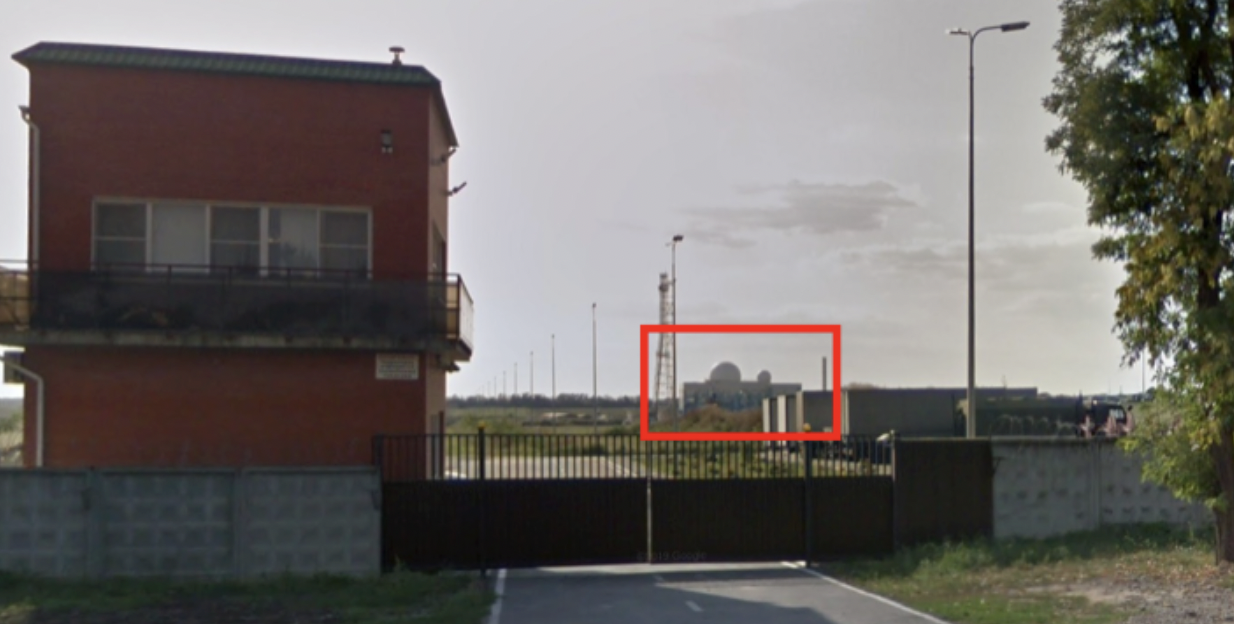
A radome (inside red square) at the Rostov-on-Don Research Institute of Radio Communications as seen from Google Street View.
According to Wikimapia, this facility is operated by the Rostov Research Institute of Radio Communications (RNIIRS), which is a subsidiary of the Federal Security Service of the Russian Federation (FSB).
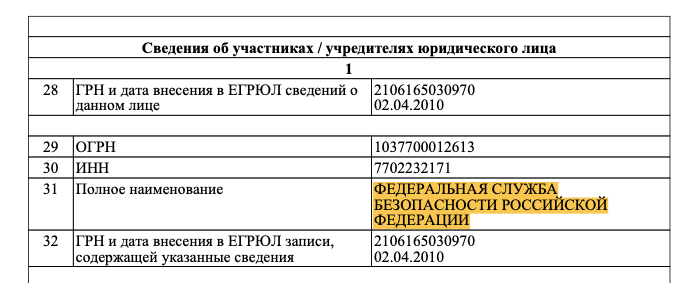
The Russian tax service website registration for Rostov Research Institute of Radio Communications.
Entries in registration documents from the Russian tax service website (and other sites) provide a list of “authorised activities” that RNIIRS can pursue, including “providing advice to security services”. Though the precise nature of this radar system cannot be determined, it’s unlikely to be a weather radar given the facility appears to be registered as a subsidiary of the FSB. Why interference is detected around here in June and July 2021 and not any time before or after is also not clear. Could another type of military radar or mobile missile defence system have been present in the area during this period before moving on or is this facility the most likely source? Further research certainly seems an intriguing prospect given the developing situation near the border with Ukraine.
One thing to note about the RIT tool, and Sentinel-1 in general, is that there has traditionally been a five-day revisit time as the satellites circle the globe. However, a recent issue with one of the satellites in the constellation has doubled that time. This means that when Sentinel-1 is fully operational, and when it captures a particular spot, it will not return to view that same site again for at least another five days. If a military radar is switched on and then switched off again in that time, Sentinel-1 will not capture it.
That being said, a very large number of active ground-based radars can be seen using the RIT tool.
Other areas of interest where interference suggests a missile defence system may be present include the White Sands Missile Range in New Mexico, USA, and the Dimona Radar Facility in Israel.
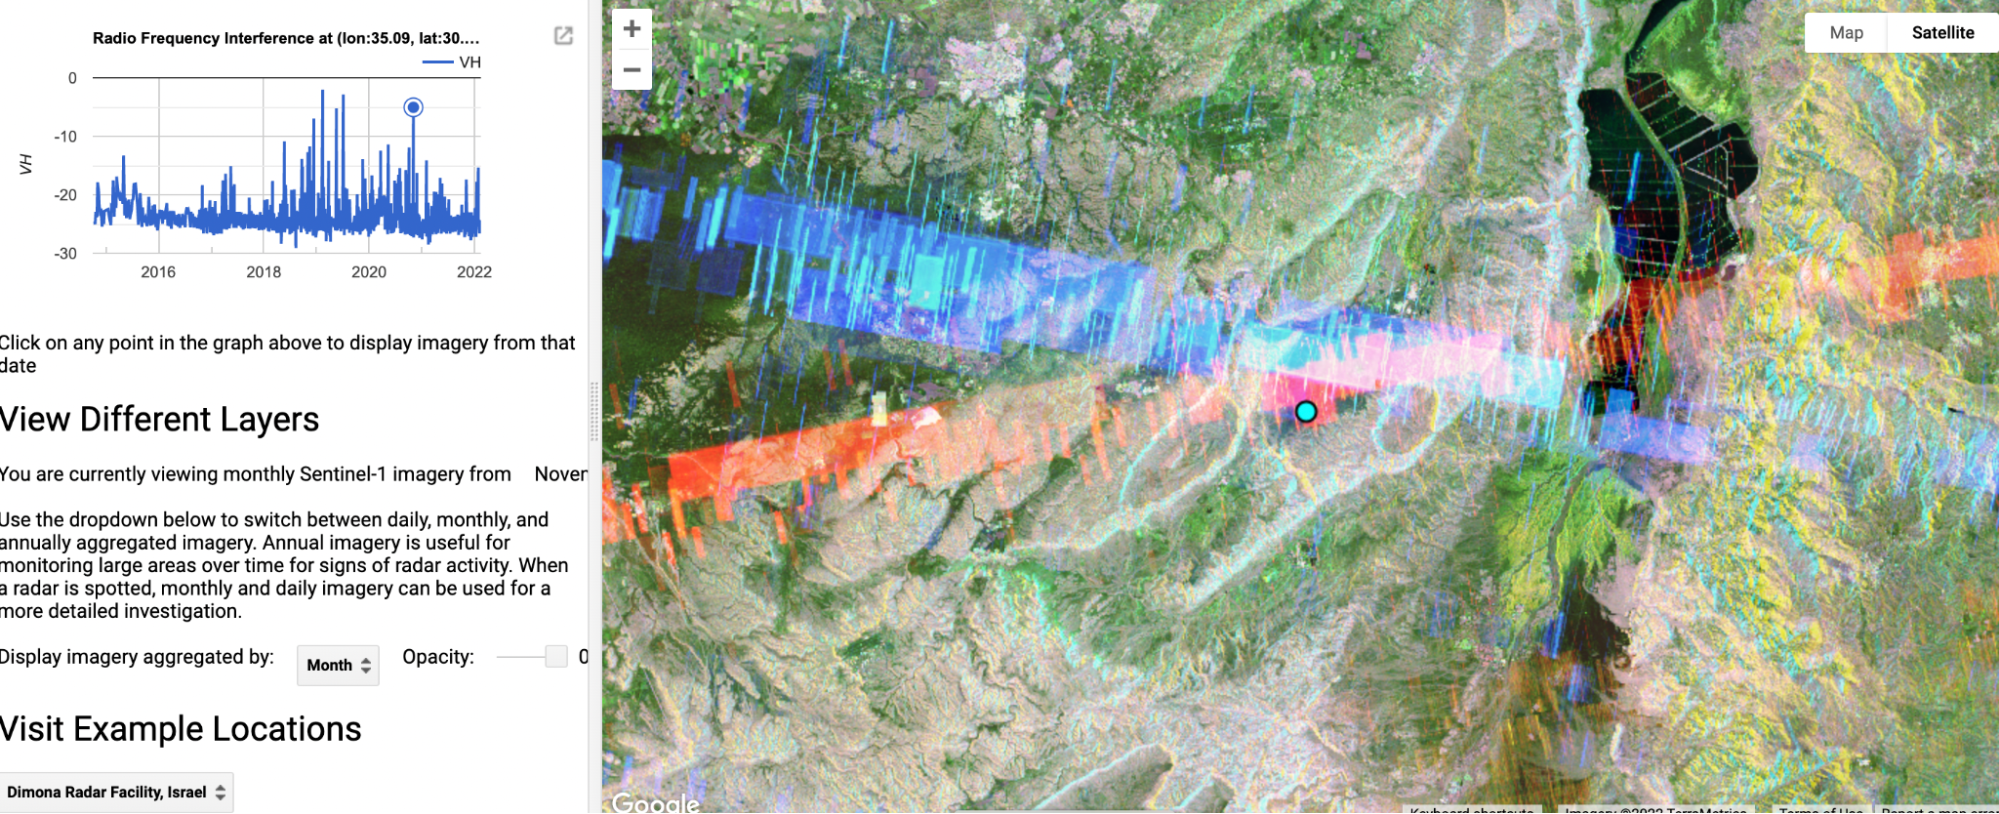
Interference is detected at the Dimona Radar Facility in Israel.
Bellingcat has included the RIT tool in its toolkit and published the source code on it on its Github page.
Researchers and analysts are encouraged to try out the RIT tool and share their findings.
It should be noted that not every instance of C-band radio frequency interference is caused by a military radar. A range of ground-based systems use the same frequency, from weather radars to telecommunications infrastructure – all of which are picked up by Sentinel-1.
For example, the map displayed here shows interference over Europe, with pins indicating the locations of weather stations visible on the World Meteorological Organization website. Though interference does appear to be somewhat higher around certain weather radars and cities, these only produce weak signals compared to military radars. For a thorough technical overview of RFI detection and localisation using Sentinel-1, see this article.
How to use the Radar Interference Tracker
Although the RIT tool should be relatively intuitive, the following guide describes how to use it and what each highlighted component on the tool’s dashboard does.
Below is a screenshot of the tool in use with five labelled components, each of which we will look at individually. In this example, the tool is centred on a MIM-104 Patriot PAC-2 missile defence system stationed in Dammam, Saudi Arabia. The imagery displayed is an aggregate of the collection of radar interference from January, 2022.
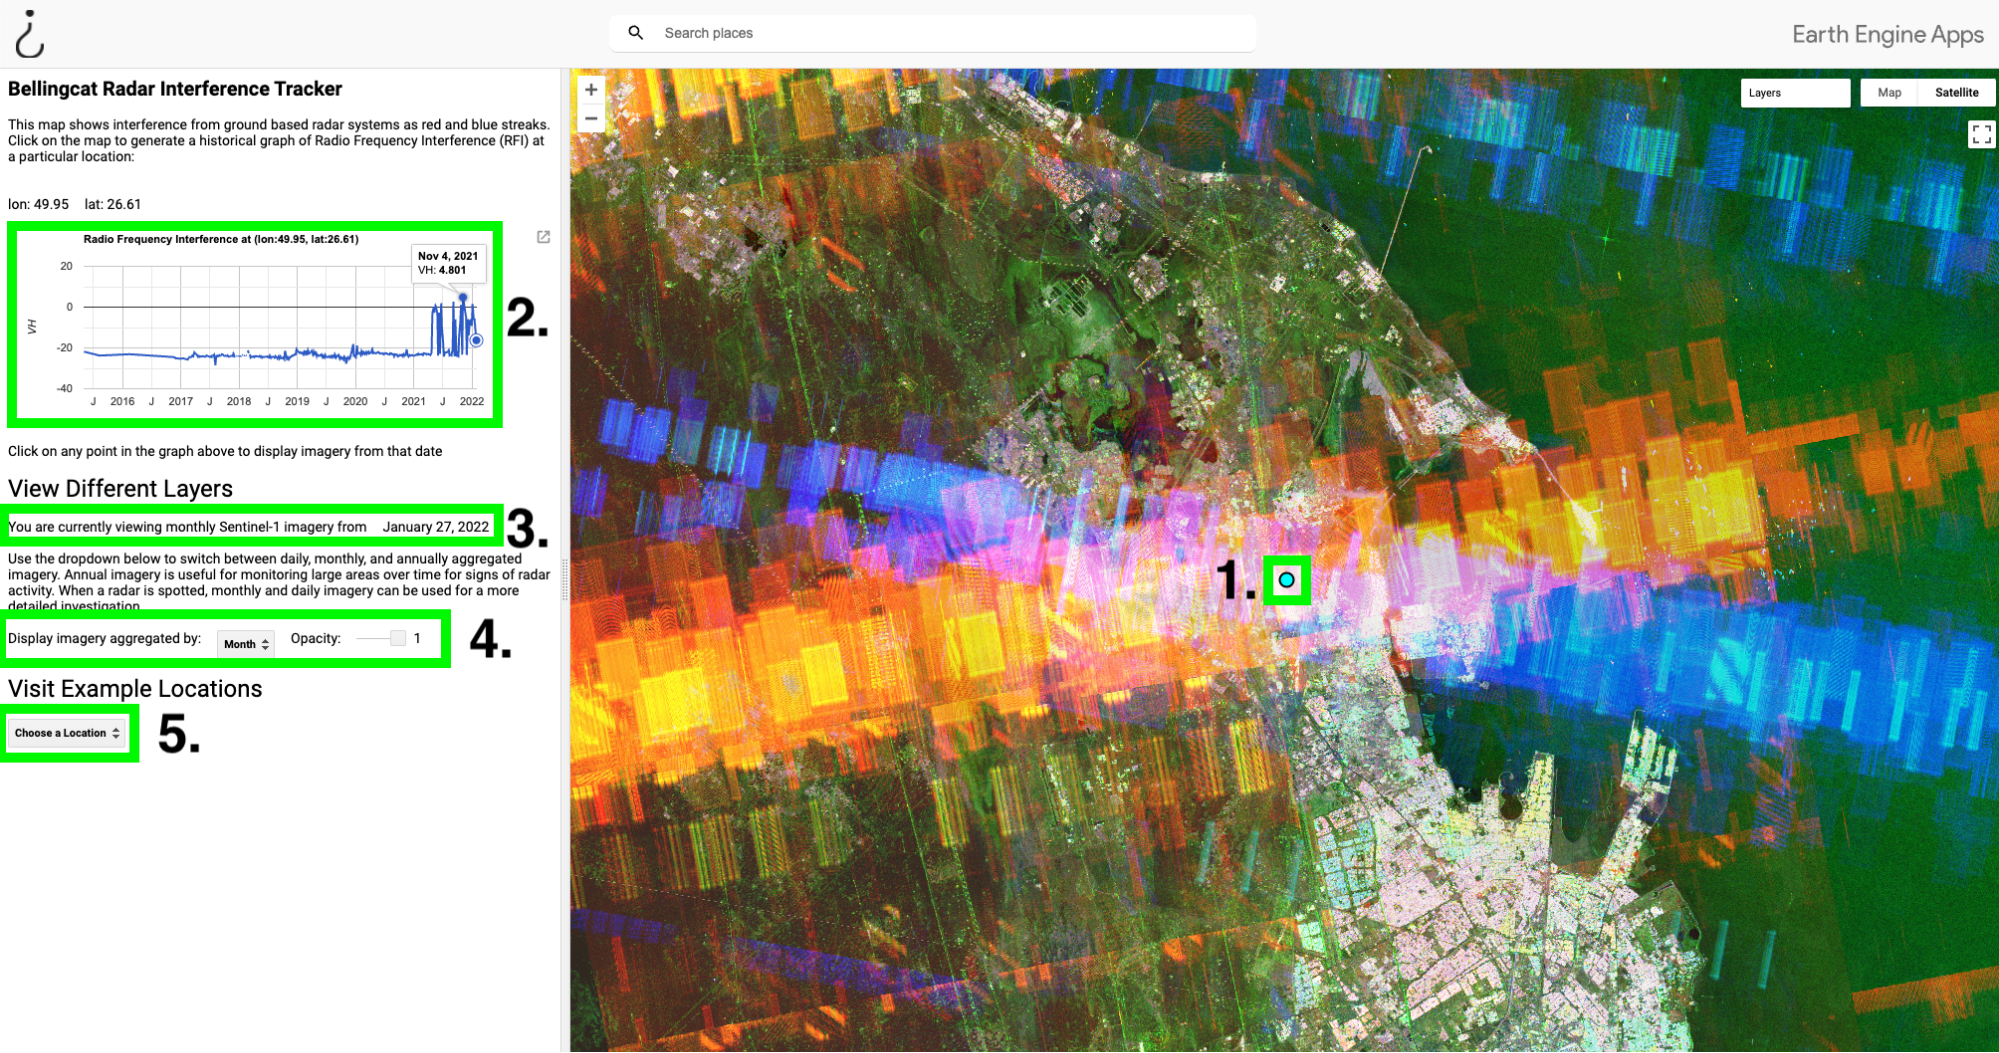
An annotated interface of the Radar Interference Tracker.
- The dot at the centre of the screen indicates the location at which Radio Frequency Interference (RFI) is being measured. Users can measure RFI at any location by simply clicking on the map at the point they wish to investigate.
- The graph on the left shows historical Radio Frequency Interference (RFI) at the location of the blue point in the centre of the map. The red and blue stripes on the map correspond to the large spikes in this graph, which generally indicate the presence of a military radar or another source of C-band interference. In this example, we can see that this radar was turned on at some point in mid-2021. Hovering over the graph will display the date that the imagery was captured, and clicking on the graph will load imagery from that period. Users can download the graph by clicking the button to the right of the graph.
- This line indicates the date and level of aggregation (year, month, day) of the imagery being displayed.
- The dropdown menu allows users to aggregate satellite imagery at three levels; Aggregating by year is time consuming, but useful for dragnet monitoring. If a radar is detected at any point in a given year, it will be visible in this layer. Aggregating by month or day is much quicker, and useful if you’ve already found a radar and want to investigate it further. The opacity of the radar layer can be toggled with the slider on the right.
- To visit the locations of known radars, select one of the locations from this dropdown menu.
With the site at Dammam now analysed, what if we want to now look elsewhere?
In the GIF below, we navigate to a different interference signal just north of the one in Dammam by dragging the map. If we click on the signal, a new graph is generated that provides historical information on RFI at those coordinates.
By hovering over the graph, we can see that there are three main points in the recent past that this radar was active due to visible interference spikes in April, September, and December 2021. By clicking on the spike in April we can load historical imagery from that period, revealing a strong interference signal. By clicking on a random period where there are no spikes in the graph (July 2020), imagery showing no interference is loaded.
By default, the imagery being displayed in the tool is aggregated by month. This means that if interference is detected at any point during a given month, it will be displayed on the map.
Aggregating by year takes longer to load, but is very useful for monitoring a large area; If interference is detected at any point during a year, it will show up. The GIF below shows how the yearly aggregate can be used to spot radars near the Ukrainian border.
The GIF begins with imagery from the month of May 2021. No signals were detected during this period, so there’s not much to look at.
If we alter the timeframe in the dashboard on the left side of the tool to aggregate by year, however, suddenly we see two strong signals: one in Liski, and another in Pogonovo. By clicking on the signal in Liski, we can see that the radar was only detected one day in 2021, November 13. But this is all it takes to spot it if we aggregate by year. Clicking on the spike on the graph loads imagery from that date, and we can load the specific imagery from that day. Daily imagery will appear purple (full reasoning for this can on the Bellingcat GitHub page).
Once you’ve spotted a radar, you can find the precise source by zooming in to the interference stripe. By reducing the opacity to reveal the high-resolution satellite basemap. In the GIF below, we zoom into the signal in Liski, and reduce the opacity to find what appears to be a military base in the centre of town.
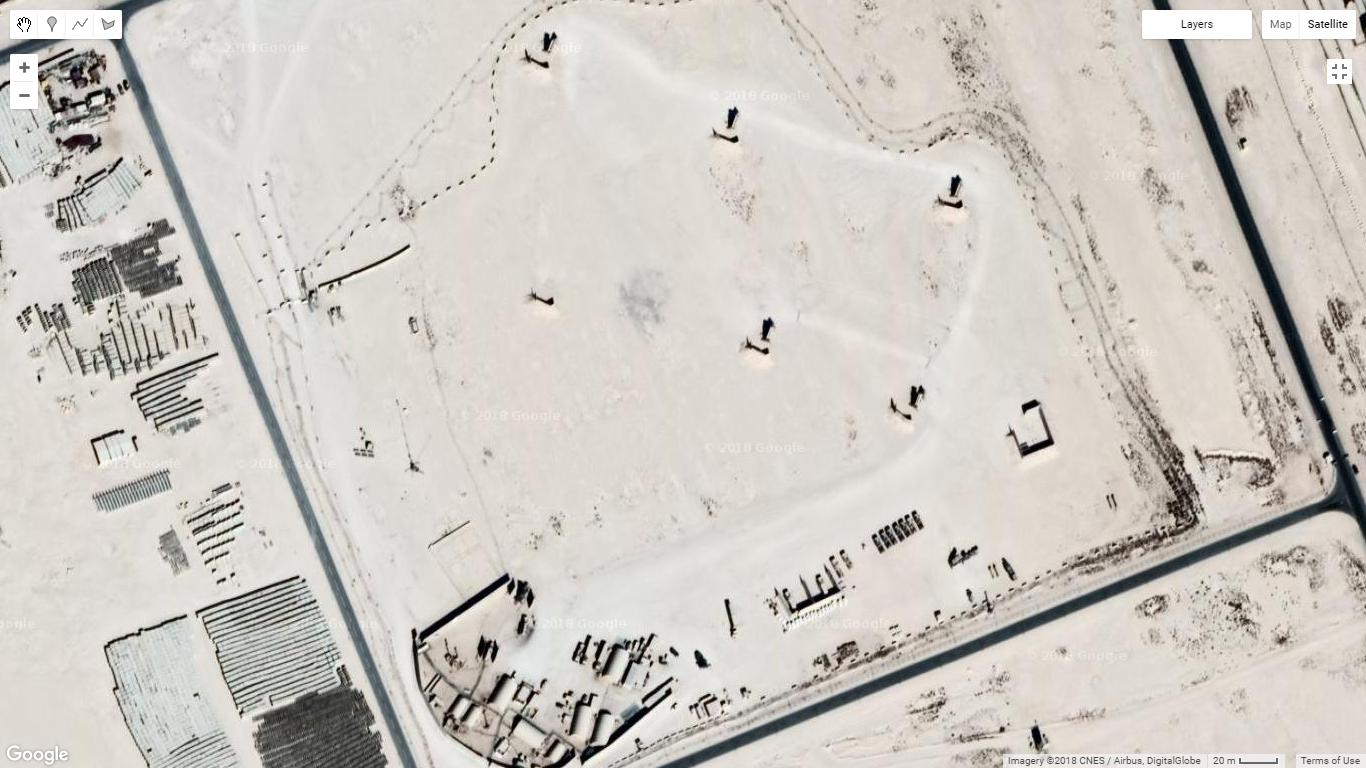
To use a different example where we can even identify the actual weapons system likely causing the interference, let’s go back to Dammam, Saudi Arabia.
By selecting Dammam from the dropdown menu under “Visit Example Locations”, the view zooms in to the point at the centre of the interference stripe to reveal a MIM-104 Patriot PAC-2 missile defence system. At the centre of the system are three vehicles indicated by the highlighted boxes: the AN/MPQ-53 radar (red), the control station (blue), and the power generator truck (green). The black boxes indicate the missile launcher trucks. A close up view of the components of a Patriot missile battery is available in this video by the U.S. National Guard.
There are two important caveats in this step. The first is that the high resolution satellite basemap is not necessarily current. Although imagery is generally fairly recent, it can be a few years old. For example, if an S-400 Surface to Air Missile is set up in a random field in 2021 but the basemap imagery is from 2020, we won’t be able to see the weapon system itself. More recent or specially commissioned commercial satellite imagery may be required to further investigate.
The second caveat is that there is no guarantee that the signal is coming from a given facility. There could be multiple potential sources in the interference stripe, and just because something looks like a military base, it doesn’t mean that it is.
To recap, in order to monitor a large area for the presence of ground-based radars in the past seven years, follow these steps:
Navigate to your area of interest by dragging the map and zooming in or out.
- Where it says “Display imagery aggregated by”, select “Year” from the dropdown menu.
- Click on a random date in each year to load data from that entire year
- For example, clicking on June 10th, 2018 will load a composite image for all of 2018.
- Repeat this for each year.
- If you spot interference, click on it to reveal the dates that the signal is detected.
- Zoom to the interference stripe and gradually decrease opacity to find the source of the interference using the high resolution satellite basemap.
One of the greatest challenges for open source investigators is knowing where to look or uncovering that first clue that enables a search to be significantly narrowed. The Radar Interference Tracker allows anyone with an internet connection to conduct dragnet monitoring of large areas for the presence of military radars.
Knowing when and where military radars are deployed could reveal previously unknown military installations, troop deployments, or maritime corridors that are frequently patrolled by a country’s Navy or Coast Guard. The timing of a signal could reveal when a facility is on high alert (i.e., when they turn on a missile defence system).
This tool is designed to allow people who are knowledgeable or interested in a particular area (but not necessarily radar enthusiasts) to easily identify and research patterns in the deployment of military radars.
To get started, open the tool and explore known military radar installations using the dropdown menu under “Visit Example Locations”.
Bellingcat is a non-profit and the ability to carry out our work is dependent on the kind support of individual donors. If you would like to support our work, you can do so here. You can also subscribe to our Patreon channel here. Subscribe to our Newsletter and follow us on Twitter here.