
When People Sleep: Determine Facebook Activity Using Google Chrome, Javascript and Python
Translations:
This article was originally published on the AutomatingOSINT.com blog.
It is always an interesting question and one that was posed over on the IntelTechniques.com forums. How can you tell what hour of the day people are most active on Facebook? There are tools out there for Twitter and other platforms, but due to Facebook’s limited API it is always a bit more of a chore to extract data in this way. This time around I am not going to use Python 100% of the way, I am going to show you how to use Chrome Developer tools as a Javascript IDE so that you can write code against any web page you are currently browsing. Once we have the data extracted, we’ll use a quick and dirty trick to let Python sort it out and get it into a CSV file so that we can use Excel or Google Fusion Charts to make us a pretty graph we can analyze. Let’s get started!
Reverse Engineering Websites with Chrome
My students are inundated with me repeating how awesome Google Chrome is for digging into the meat and potatoes of a website. It is absolutely critical that you are able to hone in on pieces of a website that you are interested in, whether you are writing a web scraper or (in our case) extracting some information on Facebook post times. The first thing you should do (aside from downloading and installing Chrome if you haven’t already) is identify where exactly the content is that you are after. In our case, we are looking for the times that a Facebook user posted. We are going to use the Vancouver Canucks (best hockey team) page as an example:

We have all see these posts that have 16 hrs or 10 hrs which is indicating that it was posted that many hours ago to your local time. Let’s see what is actually behind that unhelpful 16 hrs status. Right click directly on it, and select Inspect from the pop-up menu:

This will bring up the Google Chrome developer tools pane, and this is where the awesome begins. When the developer tools pane opens it will highlight the HTML element that you have selected to be inspected. Take a look at the result below:

If you have a closer look you can see that the element selected has the string 16 hrs in it just as we would expect. However, if you look up a little further you will see an abbr tag that has a full date string ‘Saturday, March 26, 2016 at 4:00pm’ but more interesting is the data-utime attribute that appears to be a Unix timestamp (check out a converterhere). This timestamp will be useful to us, as we can easily convert it into a useabledatetime object in Python for further analysis. The trick for us will be to find all of the abbr tags and then extract that data-utime attribute from each one of them.
You should see a Console tab that is actually a place where we can drop some Javascript code so let’s do that. The code you can type in is:
|
1
|
abbr_tags = document.getElementsByTagName(“abbr”)
|
This will populate the abbr_tags variable with all of the abbr tags that are currently found on the page. Of course with Facebook, the further you scroll down the page the more posts will be loaded and the more data you will have an opportunity to explore!

Perfect. Now, as was previously mentioned, we want to extract the data-utime attribute and there is a Javascript function that does just exactly that called getAttribute(). As a test enter the following into your Javascript console:
Once you punch these lines of code in you can see that we have extracted just the timestamp portion that we want. Feel free to try to extract the big date string that I mentioned earlier!
So we have extracted one timestamp but now we need to extract ALL of the timestamps. We will do this by setting up a blank string variable, and then we will create a loop that will walk through each of the abbr tags in our array and keep adding the timestamps to the empty string:

Wonderful! Now our timestamps variable will have a list of Unix timestamps, one per line, that is ready to be dropped into a Python script for processing. The easiest way to do this is to use the copy() function in Javascript which will copy the variable into our clipboard:
Beautiful, now let’s whip up a quick Python script to process our timestamps.
Wait, Why Not Do All of This in Python?
Great question, that I know some of you are asking! Yes, we could use Selenium (which is what I teach my students) or another framework to handle all of this in Python, but at times believe it or not I prefer to quickly whip something up in a browser using Javascript. As well, anytime that you can expand your knowledge of how websites operate, including writing a little Javascript, you are going to be better off for it. Now let’s get to that Python.
The Magic of Python
As mentioned previously, Python has some very useful built in libraries that can help us convert those timestamps into a useable datetime object, and then help us determine the specific hours that an account is active during the day or night. There are a number of ways to skin this cat but I am going to try to make it as simple as possible. Let’s get started by creating a new file called fbsleep.py in our favourite Python IDE (hopefully Wing) or text editor and punch out the following code:
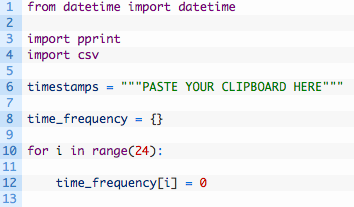
Ok so the first few lines we are just importing the necessary libraries to handle the timestamp conversion and some helper libraries for generating output. The rest of the code:
- Line 6: as it shows, this is where you will paste in your timestamps that the Javascript code copied to your clipboard. Make sure that you actually remove the ‘PASTE YOUR CLIPBOARD HERE’ part.
- Line 8: we initialize an empty dictionary that will hold all of our analyzed timestamps.
- Lines 10-12: we are creating a key, one for each hour of the day, in our time_frequency dictionary and setting it to 0. As we find timestamps that fall within a certain hour, we will increment this number. For example, a post timestamp that is at 1:00 PM would increment time_frequency[13] to 1.
Now let’s break down each of the timestamps that we have pasted in, and increment those counters as described:
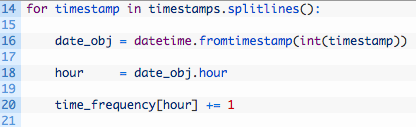
- Line 14: we walk through the list of timestamps, by using the splitlines() function to break apart our list of timestamps, one for each line. This is also why we put the “\r\n” in the Javascript code, to give us something to split on.
- Line 16: here we are obtaining a datetime object by calling the datetime.fromtimestamp function and passing in one of our timestamps. You can see we also have to convert the timestamp from a string to an integer by using the int() function.
- Line 18: we extract just the hour portion of the datetime object. You can see that you could also do some other processing here if you wanted, for example, to figure out the most popular minute that a particular account posted on. Or month. Or year.
- Line 20: we use the hour value that we have extracted as the key into our time_frequency dictionary, and we increment the current value stored in that key by 1. This is because every timestamp value we have represents one post by the target Facebook user.
- Lines 22-23: we use the pretty print module pprint to print out a readable dump of the the time_frequency dictionary. Even just glancing at this dictionary will tell you the most and least active hours in the day for a particular user. Pretty neat!
Ok so we have done the intial processing and we can see the active and inactive hours, but as always it is nice to visualize this information. One of the handiest ways to do this is to of course work with Excel spreadsheets or Google Fusion Tables. So let’s now take this data and get it into a CSV file that we can import into one of those two tools:
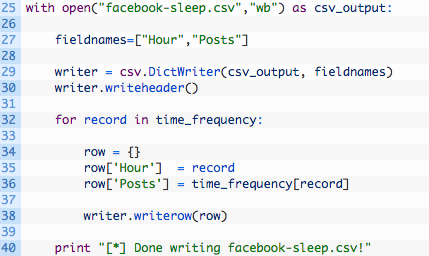
Let’s break this code down a bit:
- Line 25: we open a new file called facebook-sleep.csv for writing and we store the file handle in the variable csv_output.
- Line 27: we create a list of field names for our CSV file, which will be used as the header for each spreadsheet column.
- Lines 29-30: we intialize a new DictWriter object which will be used to write out our CSV file, and we write the header line in the spreadsheet using the writeheader() function.
- Lines 32-38: we loop through each of our keys in the time_frequency dictionary (32) and then create a new dictionary that has the same keys as our CSV headers (34) and store the hour (35) and the number of posts (36). We then write this dictionary out as a row in our spreadsheet (38).
Let It Rip!
If all goes well and you run the script, you should see some output like so:
Justins-MacBook-Pro: justin$ python fbsleep.py
[*] Here is the frequency map:
{0: 4,
1: 2,
2: 0,
3: 0,
4: 2,
5: 0,
6: 2,
7: 0,
8: 1,
9: 9,
10: 1,
11: 14,
12: 14,
13: 13,
14: 16,
15: 21,
16: 12,
17: 13,
18: 11,
19: 16,
20: 14,
21: 10,
22: 4,
23: 7}
[*] Done writing facebook-sleep.csv!
You should also see a facebook-sleep.csv file in the same directory as your Python script. Let’s now visualize this data with Google Fusion Tables.
- Head over to the Fusion Tables site.
- Import your facebook-sleep.csv file.
- Click the red plus sign and select add chart.

- Select the bar chart and set the Maximum Categories to 24 and you should see a nice graph that shows you the most active, least active and completely non-active hours of the day for the target account you were viewing.

Beauty! Of course you can play around with other chart types and different ways to visualize this data. An important thing to remember is that this is only representative of the posts that you have scrolled into view on the Facebook account that you are looking at. If you want to scroll some more downward, you will have to repeat all of the steps outlined above, but it truly does not take long at all to do.
Here is some homework, and I would love to hear from you on how you implemented it:
- Implement some Javascript that auto-scrolls down the Facebook page so that you can load all posts for an account.
- Use Python to visualize the data instead of having to use Excel or Google Fusion Charts.
- Use Python to just output which are the top three active and top three inactive hours of the day.
Send me an email justin@automatingosint.com and let me know how you did it!