Is Climate Change Heating up Central Asia’s Border Disputes? Clues from Satellite Imagery
Translations:
In late April, dozens were killed, hundreds were injured and thousands of civilians fled their homes during border clashes between Kyrgyzstan and Tajikistan. It was not the first land dispute between the two Central Asian neighbours over their often poorly demarcated border, though it was the most serious in years.
This time, the spark was reportedly a disagreement over the installation of security cameras at the Golovnaya water distribution point in the border area between Tajikistan’s Sughd Region and Kyrgyzstan’s Batken Region. The unrest then spread to other areas, some situated well over a hundred kilometres away.
The following bird’s eye view shows a tangle of borders and roads, with Golovnaya distribution point located between the narrow strip of Kyrgyzstan separating the Tajik exclave of Vorukh from the rest of Tajikistan:
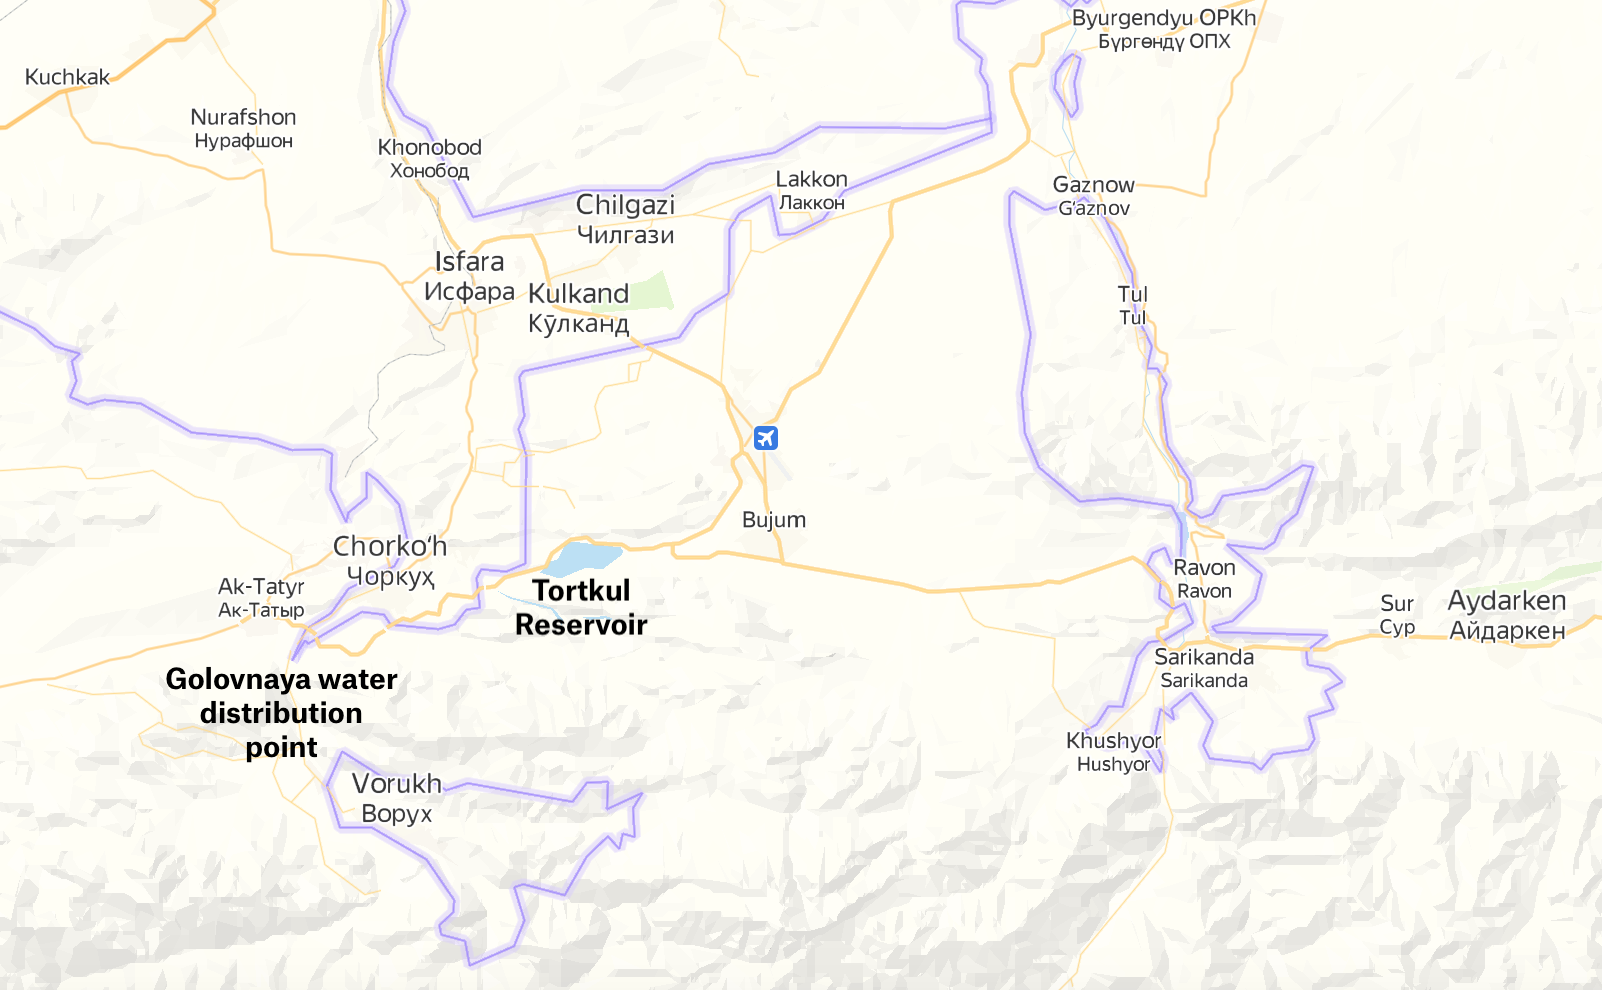
Tajikistan controls the Vorukh region in the bottom left of the image as well as the territory in the upper left, Uzbekistan controls the exclave in the right of the image and the land in the top middle, while Kyrgyzstan controls the rest. Source: Google Maps
Long-standing, complex border issues that stretch back to the fall of the USSR, as well as local political dynamics within Kyrgyzstan and Tajikistan, have been highlighted as reasons for the April clashes and their rapid spread.
But a deeper look at satellite imagery reveals another possible reason why tensions have been high in the area — its changing climate, which has put water and arable land at a premium. Data indicate less rainfall, lower ground temperature, and poorer vegetation health in the year preceding the clashes.
While this change does not suggest that farming woes were the direct cause of April’s crisis, it is a correlation which warrants serious scrutiny.
Helpfully, open sources allow us to examine this correlation to properly contextualize the role a changing climate could have played in the recent conflict between Kyrgyzstan and Tajikistan.
An analysis of Landsat 8, Sentinel 2, and other remote sensing data shows that just a few years of disruptions to the climate on the Kyrgyz-Tajik border has decreased water availability, hurt agricultural yields and increased plant stress.
Mapping the Farmlands
With that in mind, let’s narrow down our area of interest to key agricultural zones:
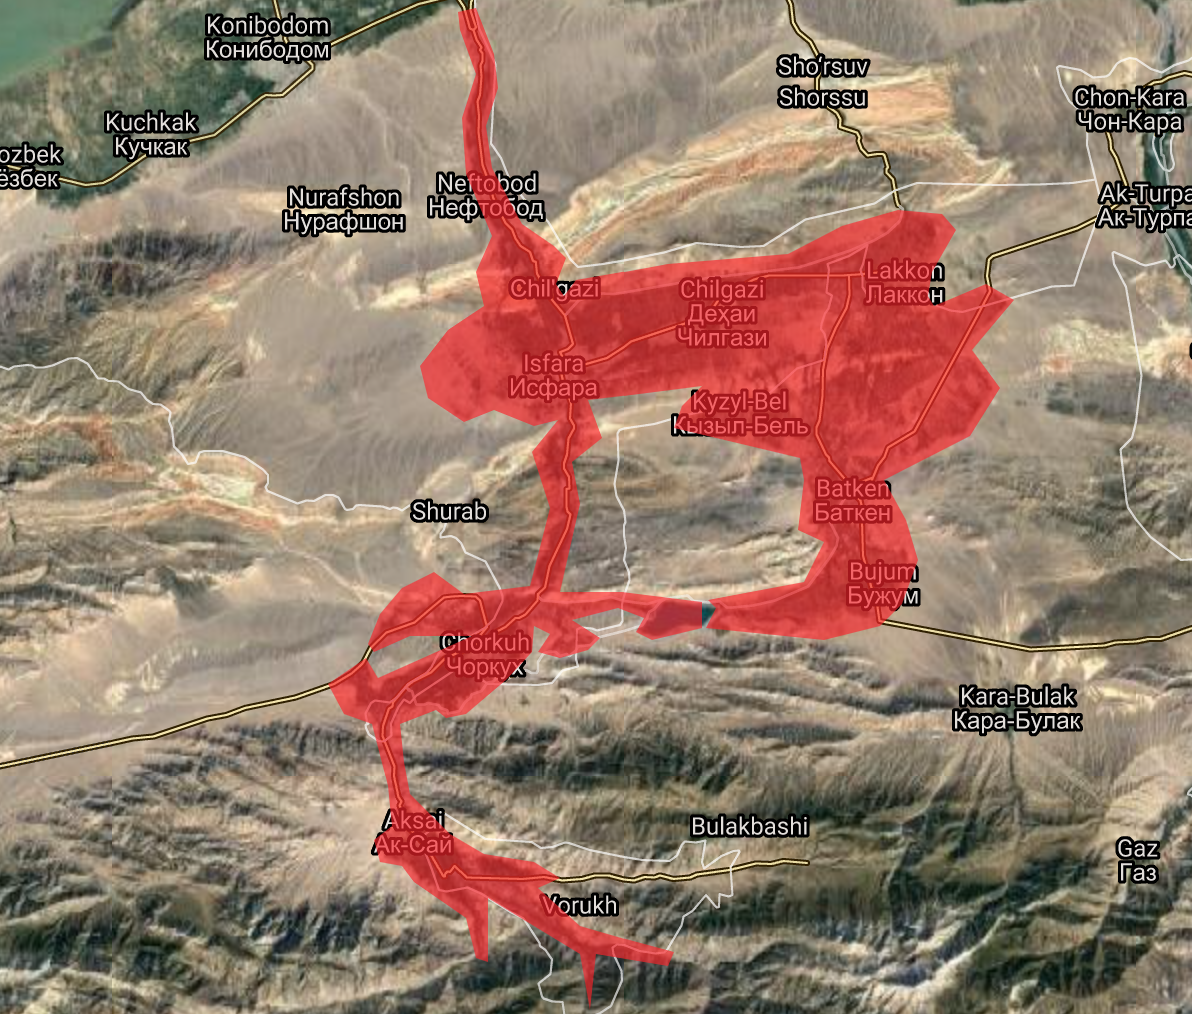
Image from Google Earth
A polygon drawn around the region’s main agricultural areas in Kyrgyzstan and Tajikistan, as seen in the image above, served as the area of analysis for the charts and images contained in this article.
The Dry Season
Most of these borderlands’ water resources are held in the Isfara River, a network of canals, and the Tortkul Reservoir.
The latter is the large body of water at the bottom of our highlighted area of interest. It’s of immense importance to farming communities on both sides of the border.
According to the Kyrgyz government, the Tortkul Reservoir is not only an “object of strategic importance” but also irrigates thousands of hectares of Kyrgyz farms. Meanwhile, farms on the Tajik side of the border also reportedly depend on water that runs from the reservoir downstream to mainland Tajikistan, via the Isfara River, canals, and the Golovnaya water distribution point.
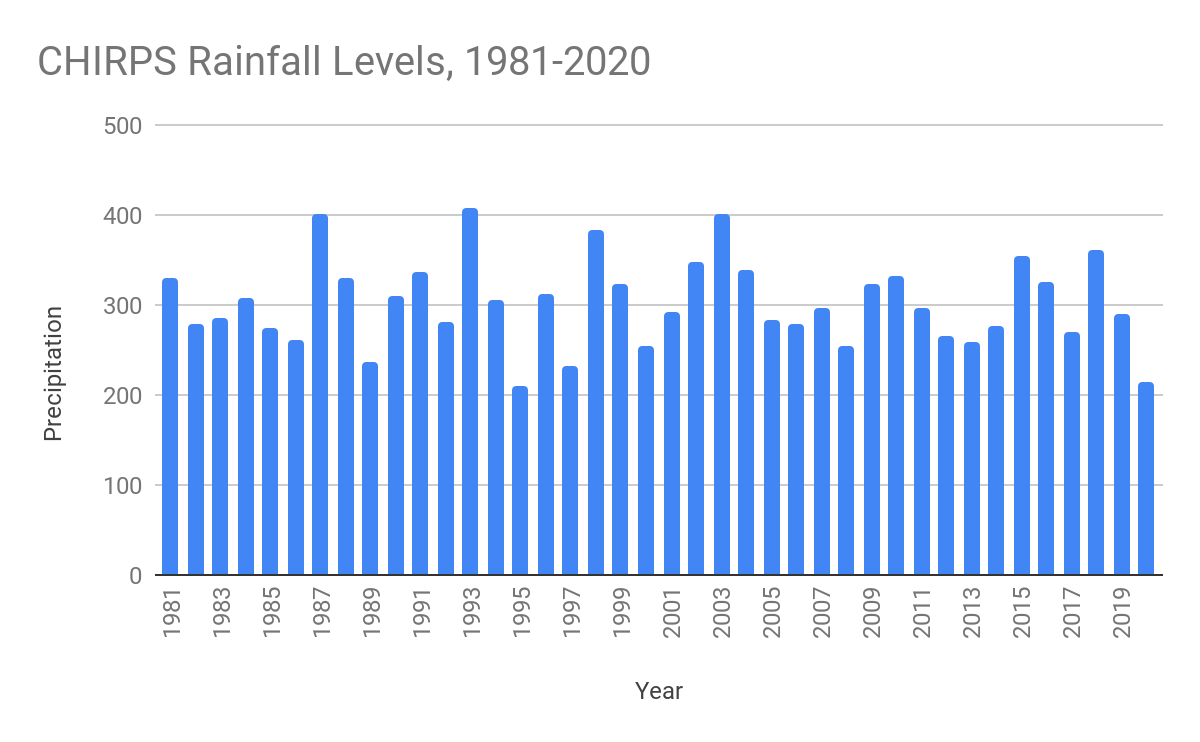
Data from the University of California Santa Barbara and United States Geological Survey’s Climate Hazards Group InfraRed Precipitation with Station (CHIRPS) program.
In 2020, the heavy seasonal rains that usually feed the Tortkul Reservoir slowed to a trickle. In fact, precipitation levels dropped in 2020 to their lowest levels since 1995. To make matters worse, 2020’s abject lack of rain followed a three-year spell of decreasing rainfall in the area.
As a result of this dry period, water levels in the Tortkul Reservoir diminished significantly. Once again, this change can be seen on satellite imagery.
A comparison of Sentinel 2 imagery between July 2018, in the summer after the most recent period of heavy spring rainfall, and July 2020, at the depth of the dry spell, shows a clear reduction in the reservoir’s capacity.
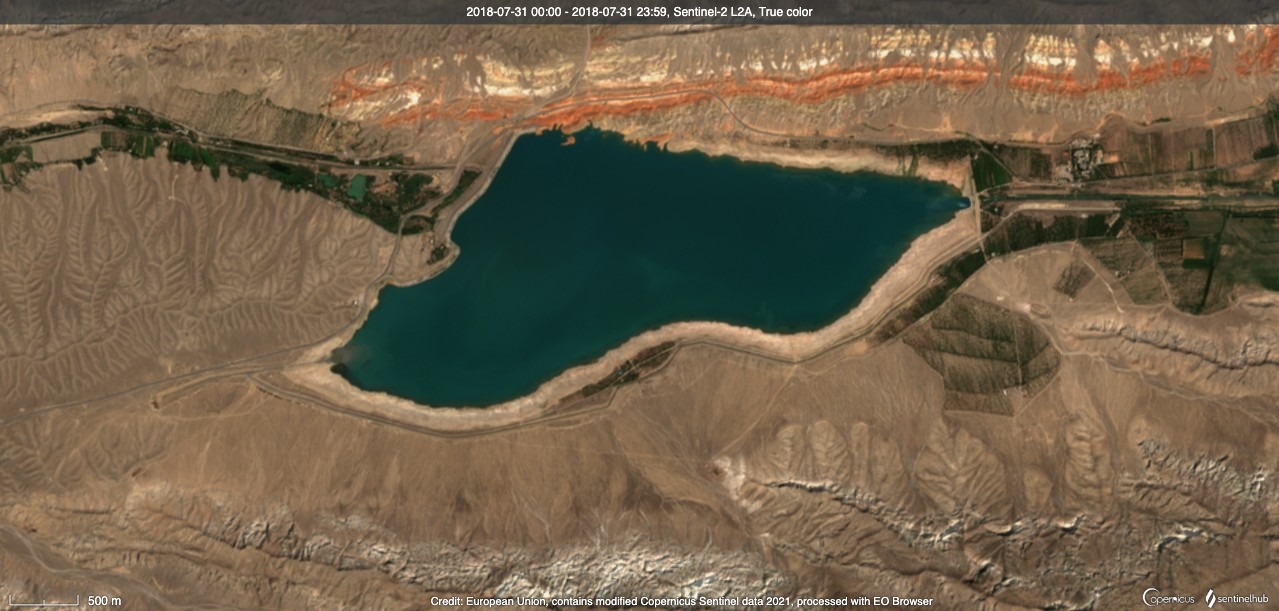
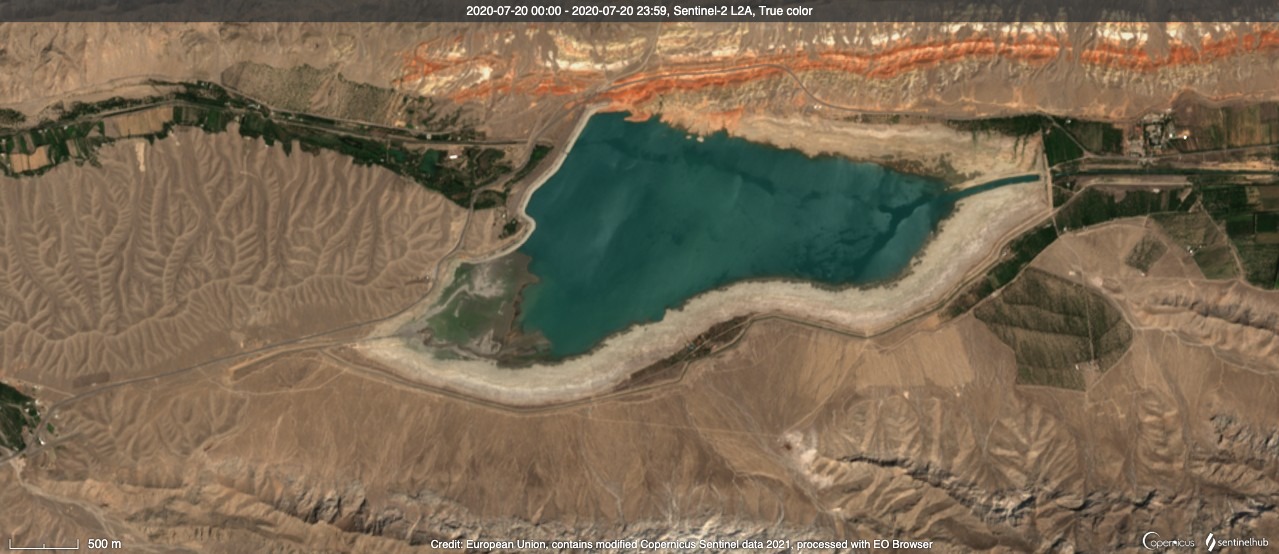
While some of the Tortkul Reservoir’s water may be used for drinking, a UN Food and Agriculture Organization report confirms the reservoir was explicitly built “to accumulate a supply of irrigation water”.
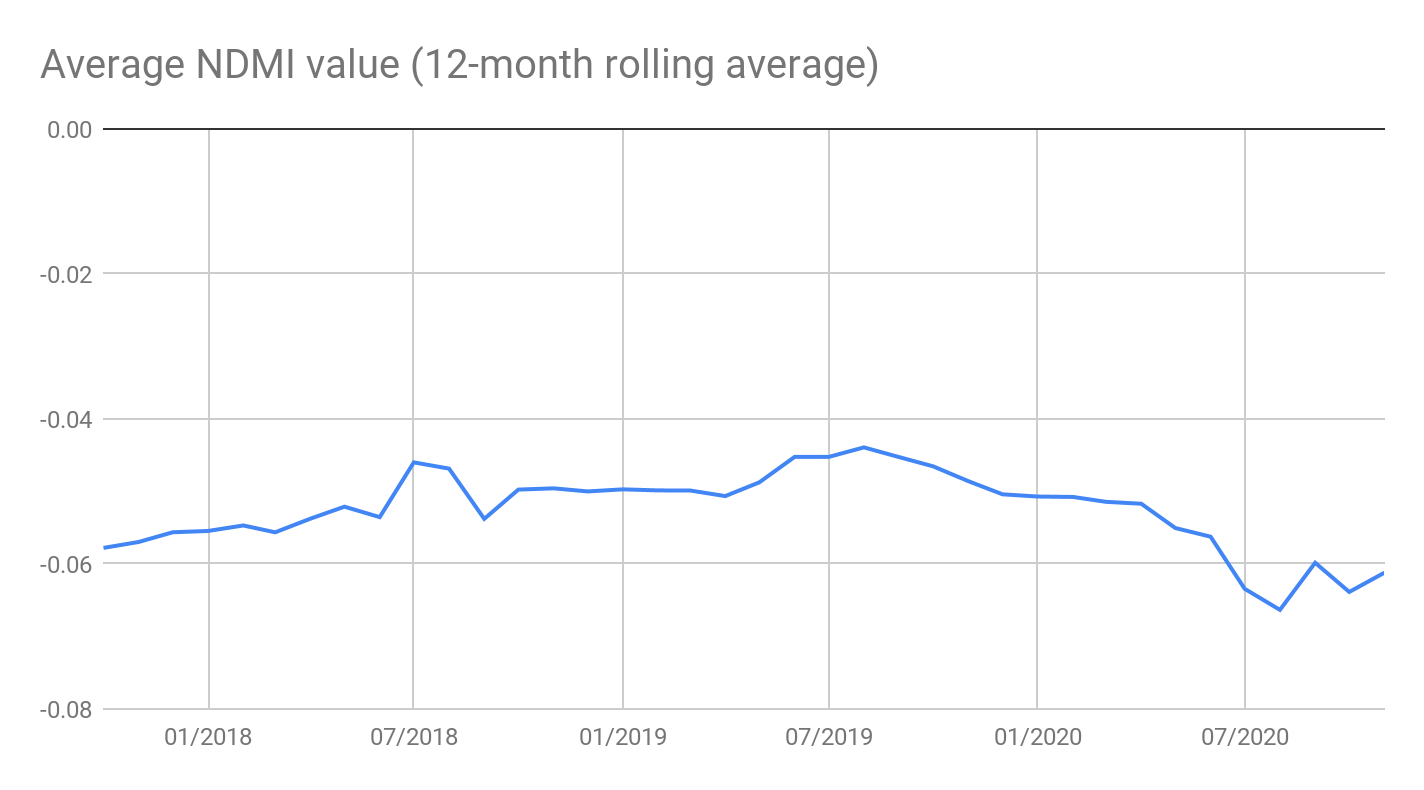
Since water in the reservoir is, more often than not, flowing to crops rather than taps, we can use another measurement to establish the water content in the region’s plants. NDMI (the normalized difference moisture index), is derived from satellite infrared measurements of plant water content and inner leaf tissue. Higher values correspond to more moisture in plants and lower values correspond to drought-like conditions.
A 12-month rolling average of NDMI values derived from Sentinel 2 imagery shows that water content in the region’s vegetation increased slightly during the summer of 2019 before plunging in 2020.
GIF from SentinelHub timelapse imagery
The difference in those colours over time is notable. It is also concerning, as less moisture in crops increases plant stress, which reduces farm productivity and can lead to pests, diseases, and crop failure.
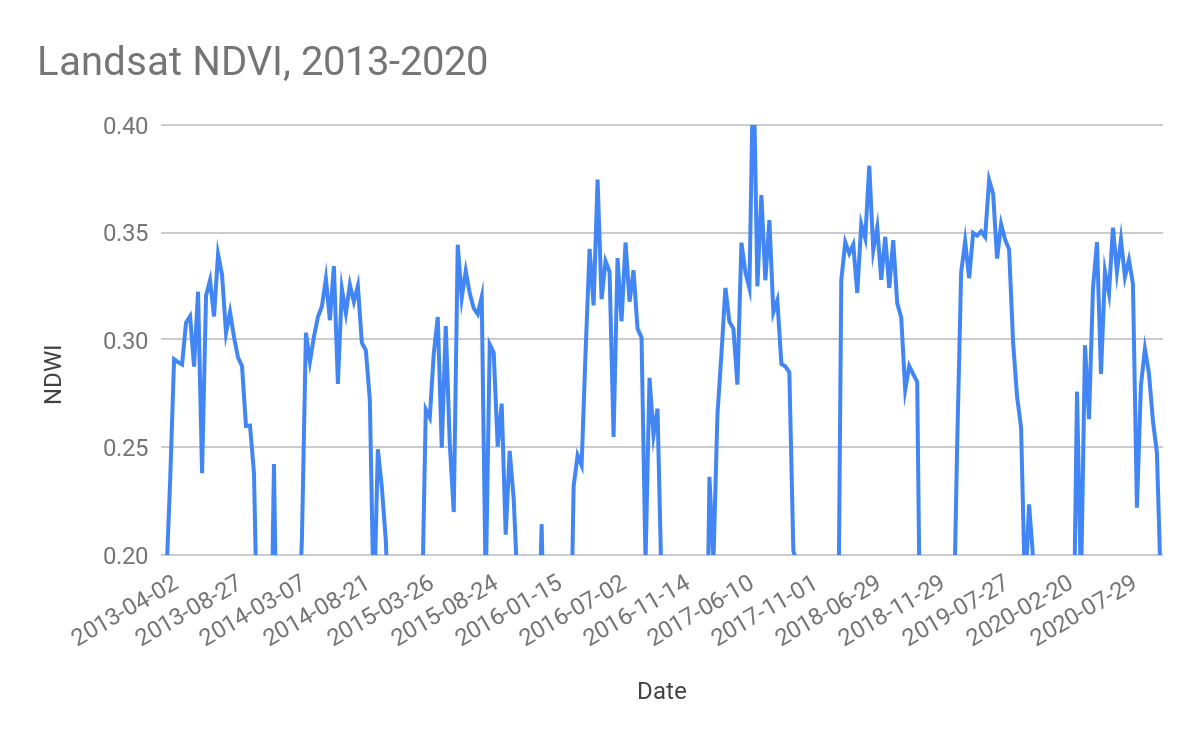
Another interesting datapoint to consider is NDVI (the normalized difference vegetation index), not to be confused with the aforementioned NDMI. This series of measurements, derived from changes in green hue on satellite imagery, shows how healthy plants in a location are. Since land in the selected region is primarily used for agriculture, NDVI can therefore be used as a proxy for how well farms in the area are doing.
An NDVI analysis from Landsat 8 imagery of this cross-border agricultural region shows a few years of steady vegetation health and, surprisingly, a few years of vegetation growth, followed by a steep drop in 2020.
Landsat 8 time-lapse imagery corroborates the apparent decline in agriculture between 2019 and 2020. Two images, taken a year apart, show thick, dense fields in 2019 followed by sparse, patchy land in 2020. The differences are especially stark in the upper left of the image (west of the Isfara River in Tajik territory), upper middle of the image (also in Tajik territory), and in the bottom right (in Kyrgyz territory east of the reservoir).
GIF from SentinelHub timelapse imagery
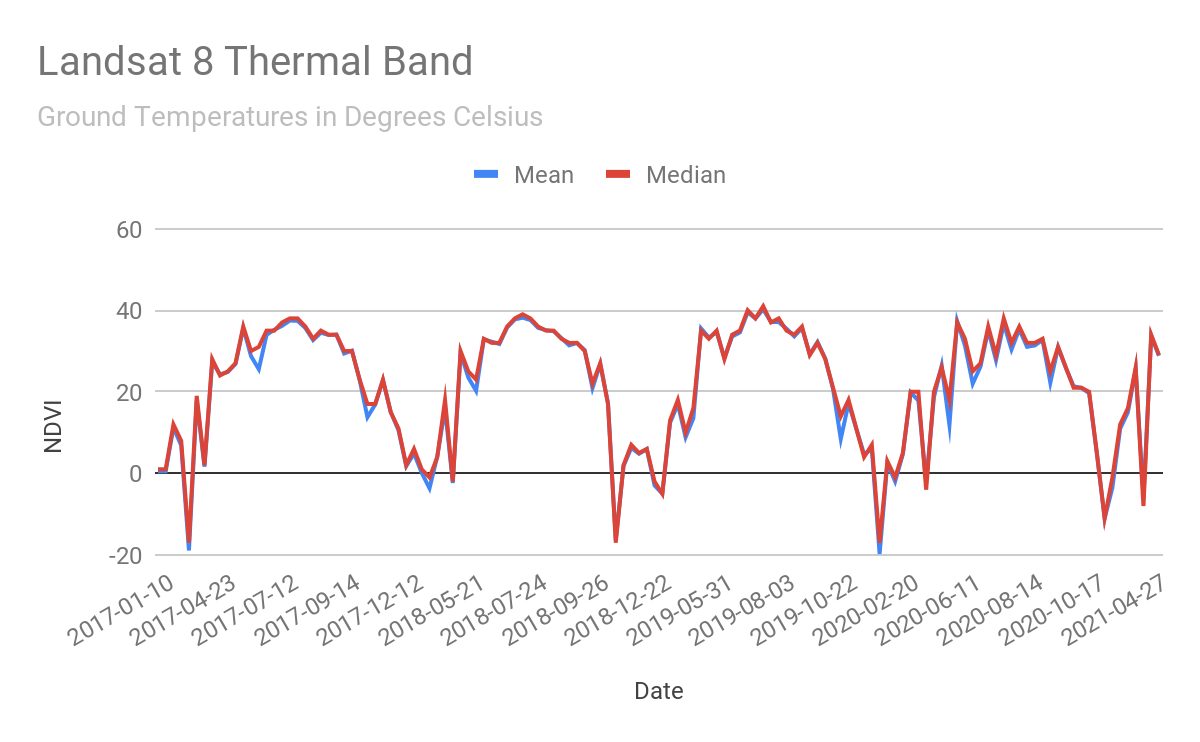
This variability is also reflected in Landsat 8’s thermal bands, which measure ground temperatures using infrared radiation. Essentially, it’s a thermal satellite image.
A chart of thermal band measurements shows a similar drop in temperatures after 2019. Ground temperatures near the Vorukh enclave, measured here in degrees Celsius, were roughly steady between early 2017 and late 2019, but become both cooler and more variable between late 2019 and late 2020.
Together, the NDVI and thermal measurements appear to indicate that in 2020, the last year for which data are available, this agricultural region suffered a collapse in plant health and a fall in ground temperature.
Boiling Point
Water supplies on either side of this intricate and often contested border are so interdependent that a single disruption, let alone the one-two punch of a decreasing water table and a cooler climate, wreaks havoc on Kyrgyz and Tajik farming communities.
It would be a stretch to say that the changes above were the direct cause of April’s clashes.To be clear, the recent conflict was immediately precipitated by the security camera dispute at the Golovnaya water distribution point. However, environmental changes could spell structural issues for local agriculture in the long term, exacerbating the potential for further disputes as resources dwindle.
Environmental changes could exacerbate the potential for further disputes as resources dwindle
Many territorial disputes have yet to even be resolved on paper. While Kyrgyzstan exercises control over the Golovnaya facility, Tajikistan’s border service claims that Golovnaya is “completely located” on Tajik territory, based on Soviet maps drawn in the 1920s and 1980s.
As a recent article for the Eurasianet news outlet noted, the facility is technically a sluice on the Isfara River that controls “water to populated areas in both Kyrgyzstan and Tajikistan downstream”. The Tajik Border Service themselves confirmed that Golovnaya is integral to irrigation in not just Tajikistan, but also Kyrgyzstan and Uzbekistan.
If, based on meteorological trends, farmers in any of these countries anticipated even less water available for farming and even lower crop yields in 2021, control of the Golovnaya sluice and the water that flows through it could be critical to local food supplies.
However, a few open questions remain. First, were the colder 2020 temperatures and reduced water measurements related? If so, did one cause the other? If not, are there additional environmental issues that may have made the fighting more likely?
Secondly, although there was certainly less water available in 2020, the remaining water released from the Tortkul Reservoir and the region’s canal network can still ostensibly be controlled by humans. Therefore, were there mitigating or aggravating human factors besides the climate that affected farmers’ water supply from 2019 to 2020? For example, did Kyrgyzstan release less water than normal from the reservoir? Did only an unusually low amount of water reach Tajikistan, and if so, why?
Finally, other local factors must be considered. Although the fighting reportedly started over the Golovnaya facility, other factors such as political and social disagreements also heightened tensions.
By itself, open source imagery can not shed light on all these complex dynamics. Nonetheless, since 2019, satellite measurements can and do show that farmers in the region had to contend with not only less water with which to grow their crops, but also cooler than usual temperatures. These may have combined to produce nearly record low farm yields in the 2020 harvest, in turn raising anxiety over 2021 yields.
As greenhouse gases and other man-made factors continue to change the earth’s climate, threatening failing crops and incipient drought, historical disagreements over who controls increasingly scarce resources take on a new urgency. Under these circumstances, a small provocation, like the installation of security cameras, can provoke a confrontation that ravages the region.