A New Tool Allows Researchers to Track Damage in Gaza
As the Israel Defense Forces (IDF) continue to bomb the Gaza Strip, many researchers are attempting to track and quantify the damage to the territory’s buildings, infrastructure and the displacement of the local population.
A new tool, originally developed to estimate damage in Ukraine, has now been adapted and applied to Gaza. The tool can estimate the number of damaged buildings and the pre-war population in a given area within the Gaza Strip.
The tool has already been used by a number of media outlets, but it is freely available for anyone to use and we have outlined its key features below.
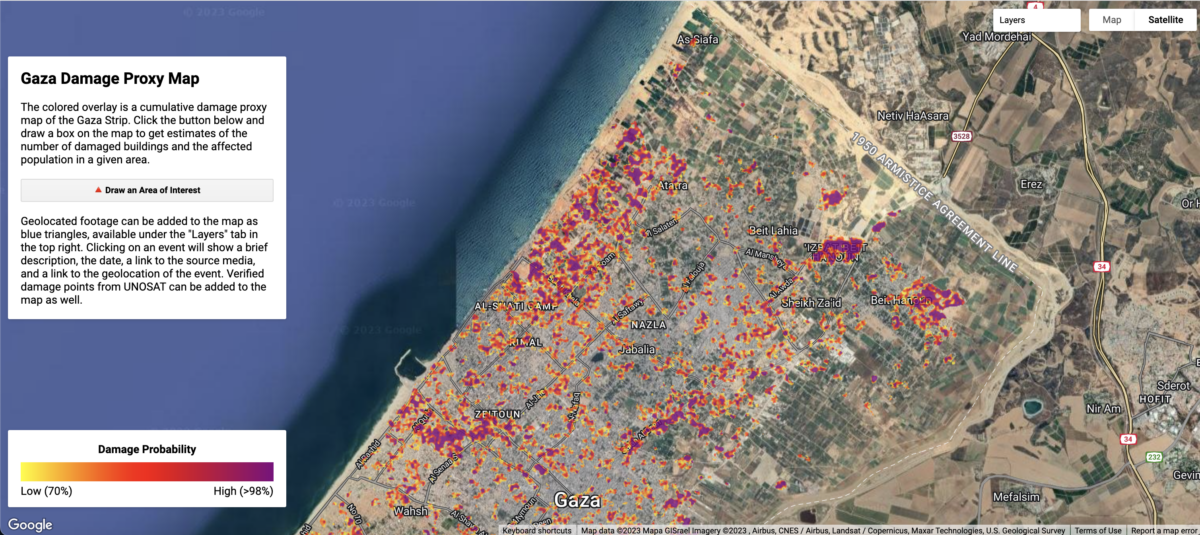
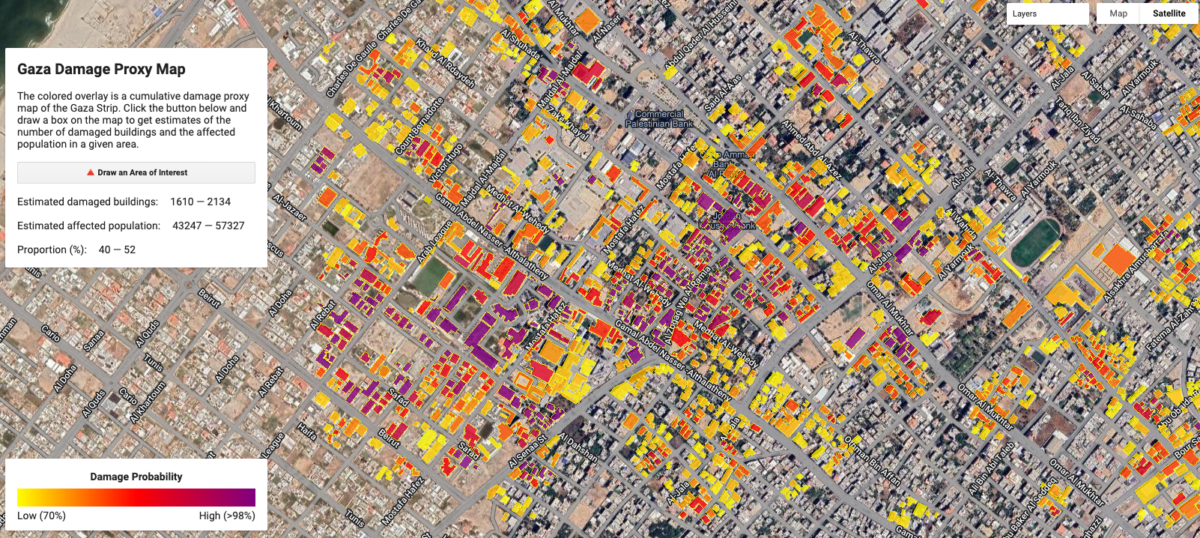
The coloured overlay on this map is a damage proxy map indicating the probability of a significant change occurring at particular locations since October 10, 2023. Users can click the “draw polygon” button to draw an area of interest on the map — for example, a particular neighbourhood.
To understand how the tool works, let’s look at the neighbourhood of Izbat Beit Hanoun, which sustained heavy damage visible in these high-resolution, before-and-after satellite images from Planet:
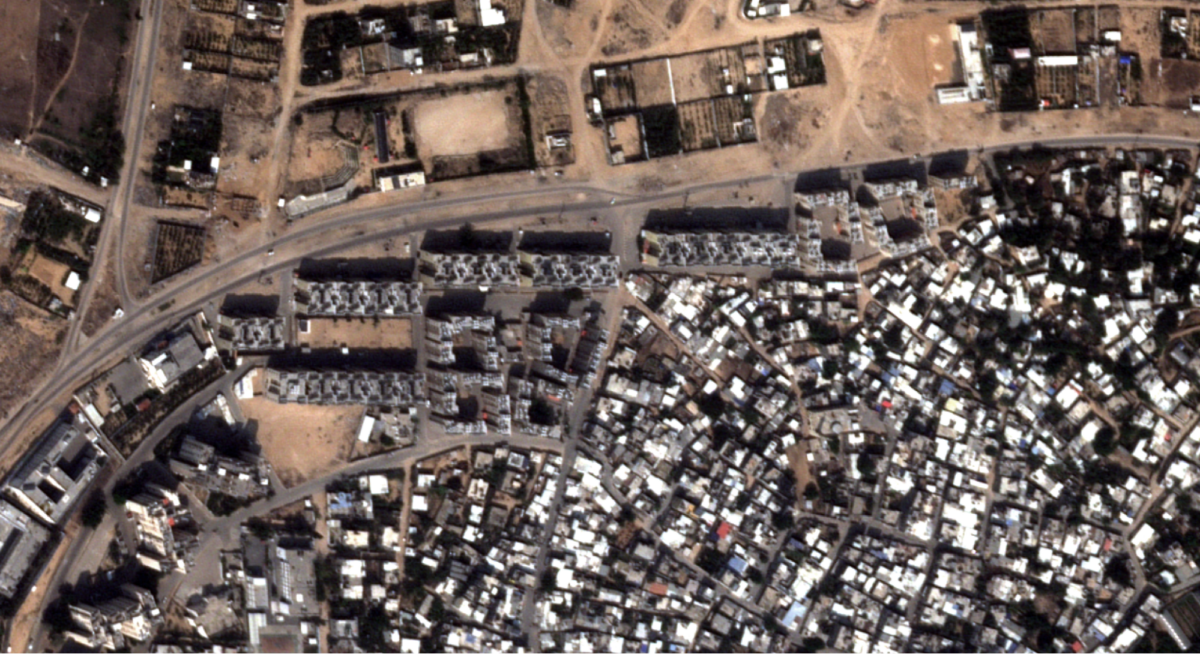
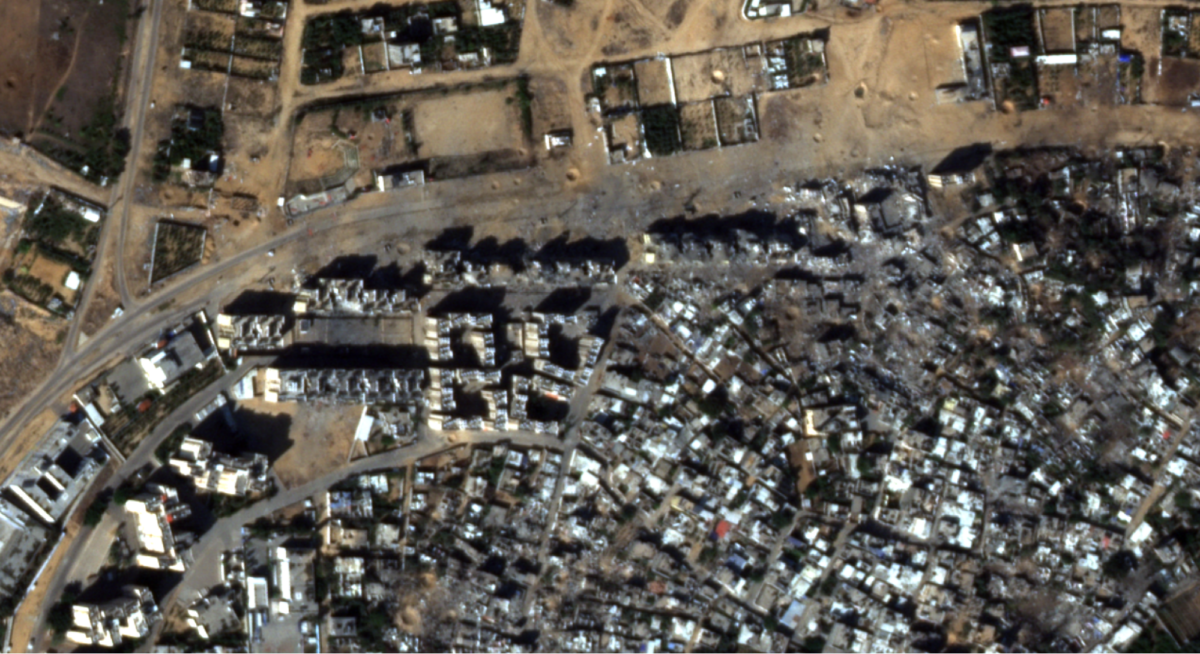
The row of apartment complexes in the north of the neighbourhood near the road has been razed. Lower-density areas in the centre and northeast of the neighbourhood have also sustained heavy damage. Airstrikes have also destroyed several of the apartment complexes in the southwest.
Below is the damage probability map generated by the tool, highlighting many of these areas:
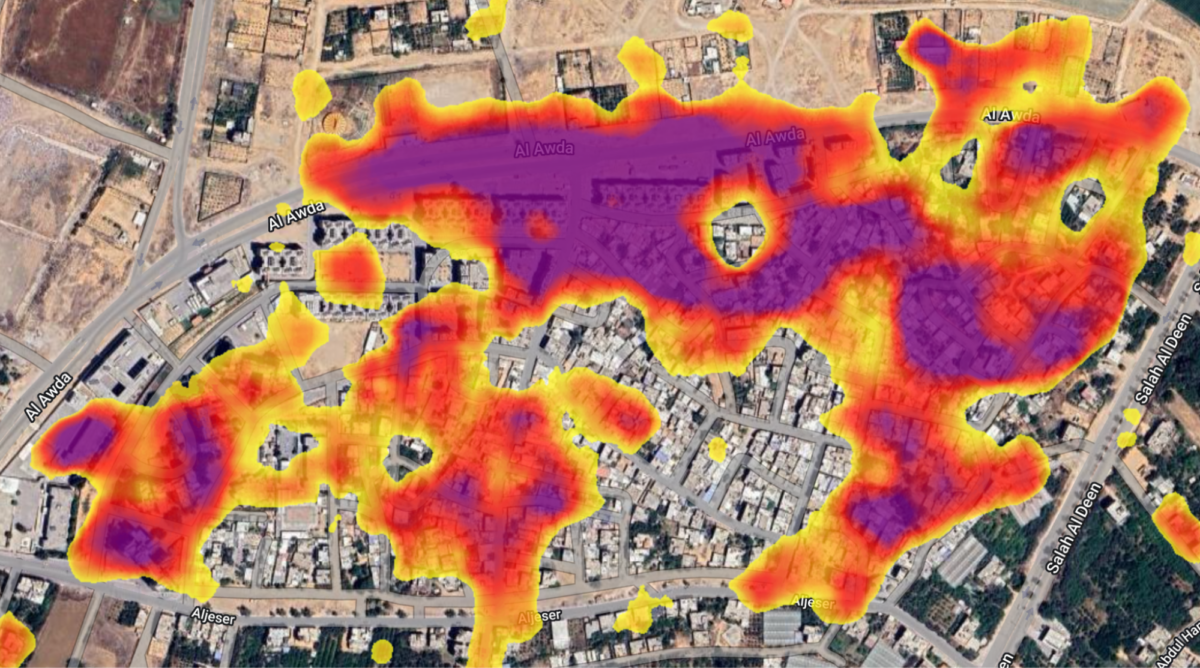
Drawing a box over this neighbourhood allows us to roughly quantify the number of buildings – and people- affected by the destruction.
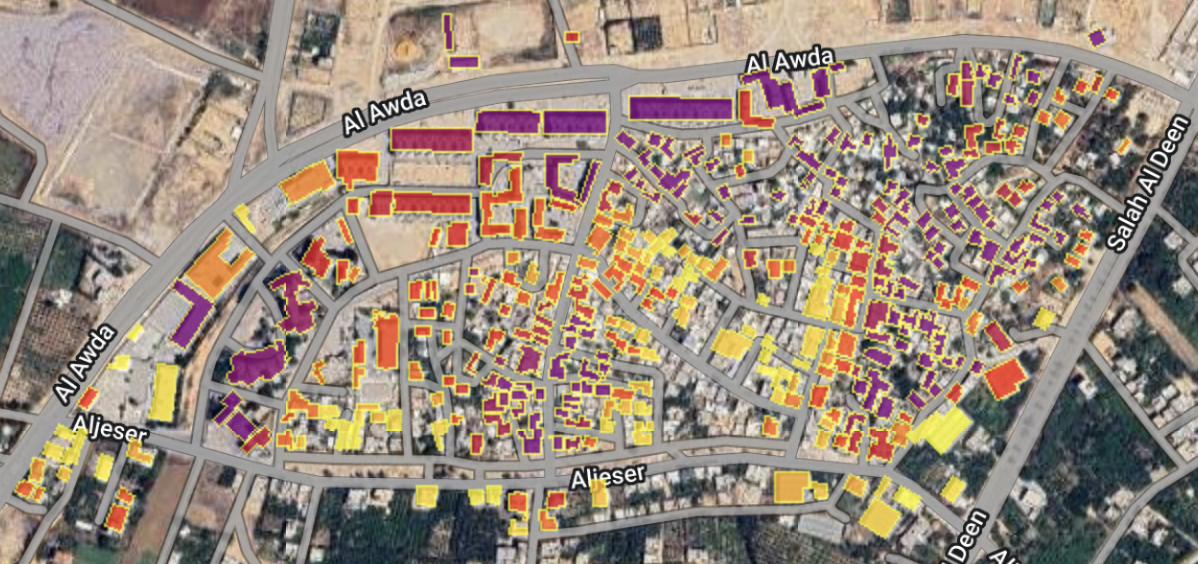
In the neighbourhood of Izbat Beit Hanoun, the tool estimates that there are 321-425 damaged buildings (73 — 97%), displayed with colours above. The tool also estimates that in the area of interest there was a pre-war population of 7,453, of which 4756 – 6304 lived in areas that are now likely to be damaged.
How it Works
Synthetic Aperture Radar (SAR) imagery has been used extensively in academic studies of building damage, and by groups like NASA following the 2020 explosion at the port of Beirut. NASA explains the use of SAR for building damage detection as follows: “SAR instruments send pulses of microwaves toward Earth’s surface and listen for the reflections of those waves. The radar waves can penetrate cloud cover, vegetation, and the dark of night to detect changes that might not show up in visible light imagery. […] When buildings have been damaged or toppled, the amplitude and phase of radar wave reflections changes in those areas and indicate to the satellite that something on the ground has changed.”
The application above detects damaged areas by measuring the change in the intensity of the radar waves reflected back to the Sentinel-1 satellite before and after October 10, 2023, adjusted for how noisy the signal is in both periods. A more detailed explanation of the algorithm (which was peer-reviewed for a conference) is available here, and a walkthrough (including code) applied to the 2020 Beirut explosion is available here.
Once likely damaged areas have been identified, the damage probability map is combined with building footprints from Microsoft. Footprints in which significant change has occurred are classified as damaged. This yields a count (and proportion) of estimated damaged buildings within an area.
To get a rough idea of the number of people affected in a given area, population data are sourced from the LandScan program at Oak Ridge National Laboratory. The data are provided at the level of 90 metres. These population estimates are generated by merging current data on building structures, occupancy rates and infrastructure. Because these are estimates, they are subject to some level of error. They also predate the current conflict and are thus not meant to be interpreted as a count of actual or potential civilian casualties. You can read more about LandScan data here.
Accuracy
To assess the accuracy of the damage detection algorithm, damage points from the UN Satellite Office (UNOSAT) were used for validation. These are generated by manually combing through high-resolution satellite imagery and tagging visibly damaged buildings. Below is the same image of Izbat Beit Hanoun, with UNOSAT damage points overlaid in white.
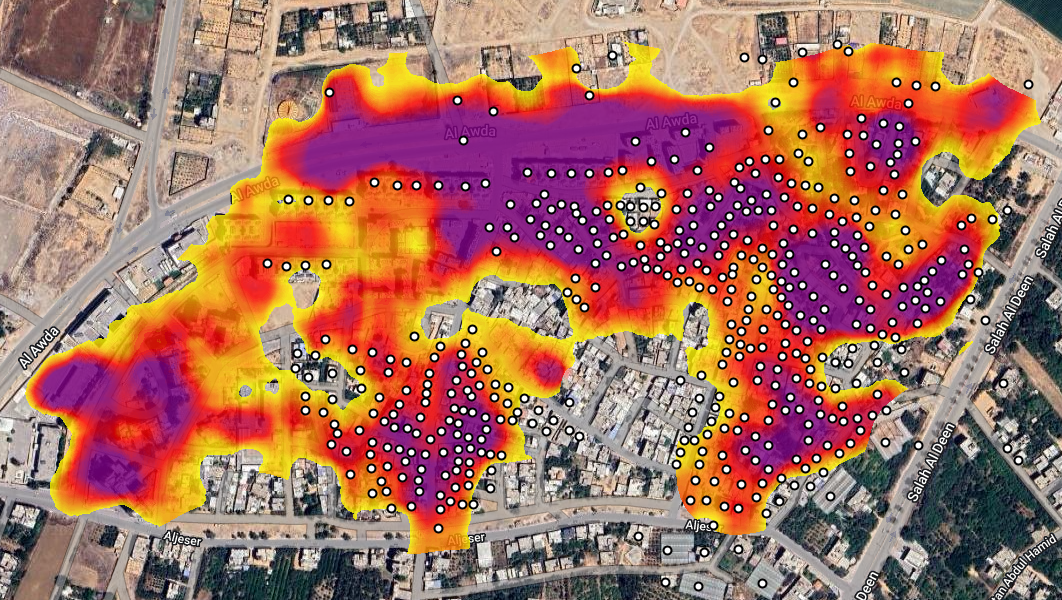
In the images above, the colourful overlay is a damage probability map. Darker colours indicate a higher probability that a significant change occurred after October 10, 2023.
The UNOSAT damage points are available under the “Layers” tab in the top right corner of the tool. It should be noted that UNOSAT carried out the assessment on November 7 and that damage has occurred since then.
More on the Algorithm’s Accuracy
The algorithm’s accuracy (the ratio of correct predictions to total predictions) at distinguishing between damaged and undamaged areas is 80.4%, based on over 25,000 labelled areas. “Precision” measures the percentage of damage predictions that are correct. On the map, 70.1% of all coloured areas are indeed damaged according to the UNOSAT data (the white points shown above). This reflects the fact that a relatively low damage probability threshold is used in order to pick up on areas that are potentially damaged, but this also leads to some false positives.
At higher probability thresholds, the number of false positives drops significantly; 95.4% of areas red and darker are actually damaged. 98.6% of the purple areas are damaged, and only 1.4% are false positives.
Geolocated Footage
To get an additional source of validation data, geolocated footage of strikes and destruction in Gaza are available under the “Layers” tab in the top right, and are displayed as blue triangles.
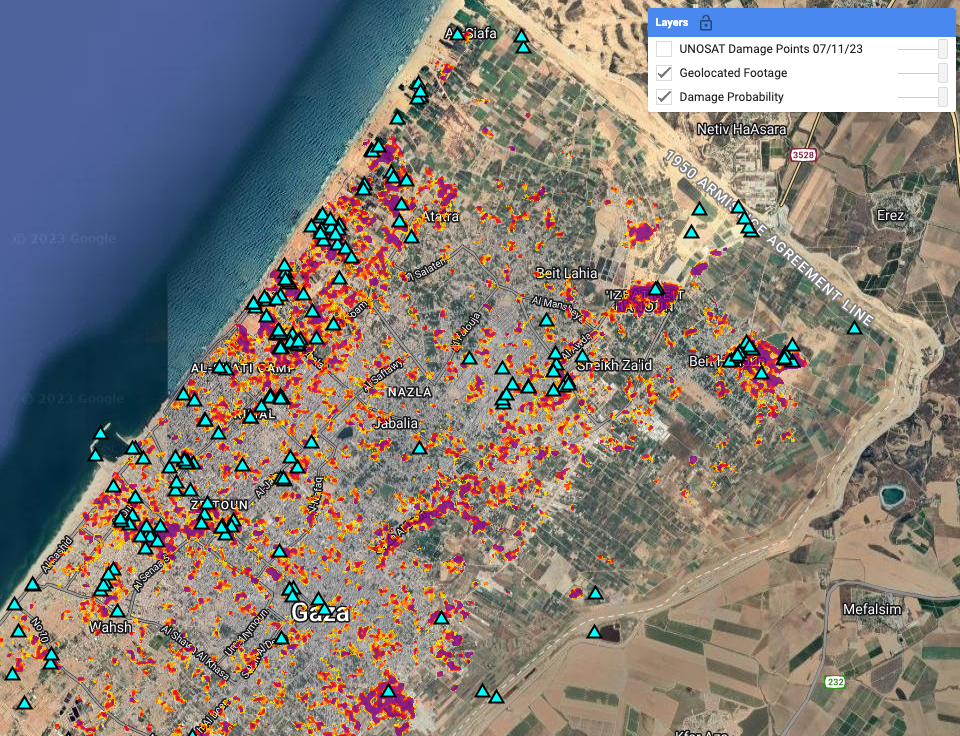
These are sourced from Geoconfirmed, a community-based geolocating network. Clicking on a geolocated event will open a panel in the top right, showing a brief description of the event, the date, a link to the source media, and a link to the geolocation of the event.
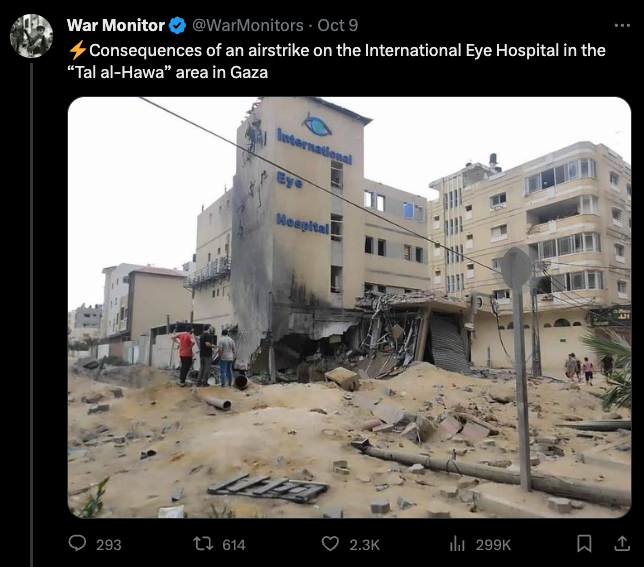
In the example below, clicking on a geolocated event in the heavily damaged Tal al-Hawa neighbourhood reveals that Gaza City’s International Eye Hospital appears to have been hit by an airstrike.
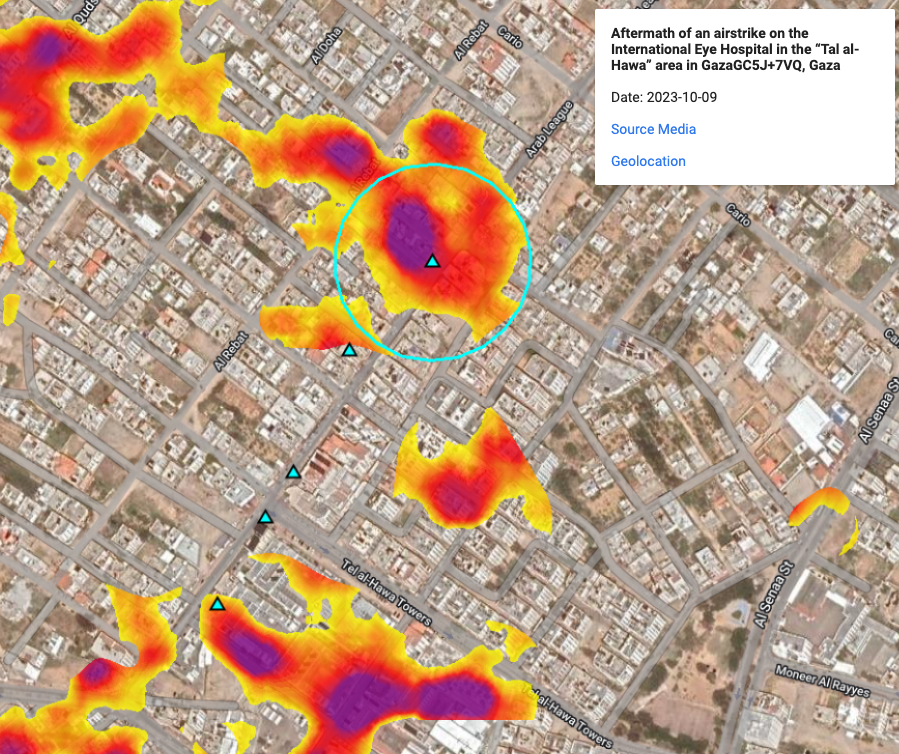
Clicking on “Source Media” shows the following image of the eye hospital.
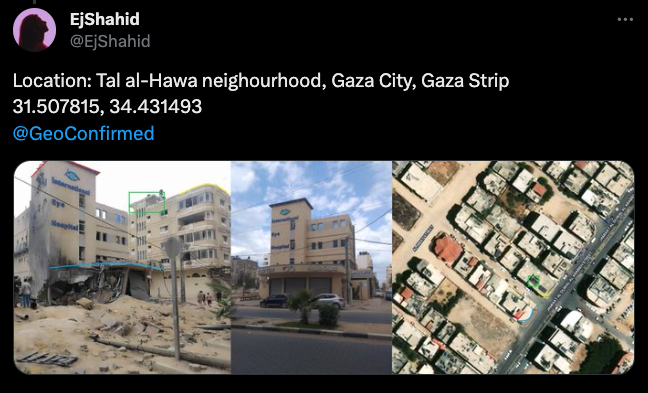
Clicking on “Geolocation” displays the following tweet, which uses the visible characteristics of the building itself and adjacent buildings to locate the picture.
Further research confirms that the International Eye Hospital was subsequently completely destroyed.
It should be noted that the geolocations have not been independently verified by the creators of the tool and are automatically added to the map as they become available. Nevertheless, these geolocations are an important additional source of preliminary information. As of the date of publication, there were 541 geolocated events in the Gaza Strip. The tool automatically adds new geolocations as they become available.
Important Caveats
While this tool can help us better understand the devastating impact of IDF strikes on Gaza, there are a number of important caveats to bear in mind when using it.
The first is that this tool detects any significant changes that have occurred in Gaza since October 10, 2023. The vast majority of these changes are likely related to conflict damage, but not all. For example, placing a large number of tents on a previously open field would be detected, since this would change the amplitude of the signal reflected back to the Sentinel-1 satellite from that patch of land.
Second, because of the way the algorithm functions, older damage will be more confidently detected than newer damage. Thus, while the tool updates automatically as new imagery becomes available, it may take some time for newer damage to become visible. Other SAR-based methods can produce accurate estimates of damaged areas on a particular date. The Decentralized Damage Monitoring Group is working on such methodologies, with the aim of publicly disseminating damage maps that show not only where damage has occurred, but when.
Finally, the assessment of population exposure is not a measure of actual or potential civilian casualties. These population estimates predate the most recent conflict in Gaza, and many civilians have fled. The affected population counts represent a ballpark estimate of the number of people who previously lived in areas that are now likely damaged or destroyed.
Accessing the Tool
The Gaza Damage Proxy Map uses previously established and tested methodology to provide estimates of damage to buildings. The data is updated approximately one to two times per week as new satellite imagery is gathered by the Sentinel-1 satellite. It therefore represents cumulative damage since October 10, not real-time damage to buildings.
Although the information provided by the tool is an estimate, it is useful for researchers to quickly gain an overview of damaged areas in the Gaza Strip.
You can access the Gaza Damage Proxy Map here.
A similar tool using the same methodology to assess damage in Ukraine following Russia’s full-scale invasion and in Turkey following the February 6 Turkey-Syria earthquake, can be accessed here.
Bellingcat is a non-profit and the ability to carry out our work is dependent on the kind support of individual donors. If you would like to support our work, you can do so here. You can also subscribe to our Patreon channel here. Subscribe to our Newsletter and follow us on Instagram here, X here and Mastodon here.