Visualizing Police Violence Against Journalists At Protests Across The U.S
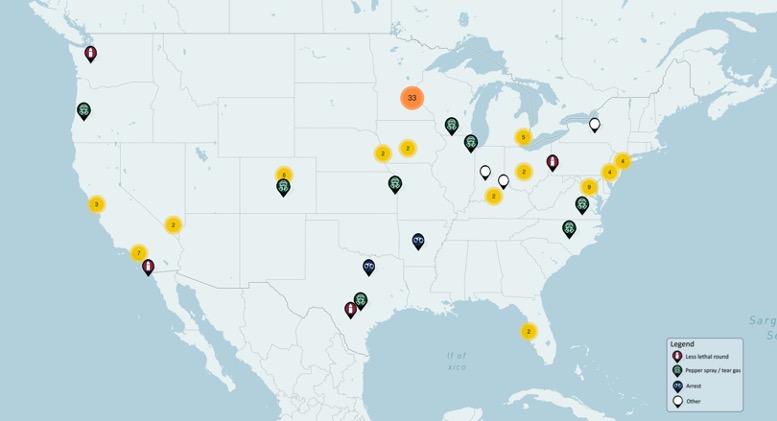
Update (July 3, 2020) -Since publishing this article on June 5, 2020, we have teamed up with Forensic Architecture to map these incidents on their platform. Today, Forensic Architecture has published that map. The map allows for navigation of the events in, time, and by category of event (i.e., “physical assault”, “pepper spray”, etc.).
Together with a team of volunteers, we are also working to map hundreds of other instances of police violence, this time targeting demonstrators and bystanders during the May and June 2020 protests. As part of this larger project, Forensic Architecture has created a submission platform that will allow users to securely submit footage of police violence against protesters and bystanders.
After watching the gruesome killing of George Floyd at the hands of Minneapolis Police Department Officer Derek Chauvin — the officer who put his knee on Floyd’s neck for almost 9 minutes — the United States has broken out in a rage. Protestors are filling the streets night after night, declaring “No Justice, No Peace” and reminding everyone that “Black Lives Matter.”
These protests have escalated into violence in many cities across the United States while police and local officials crack down and instate curfews. As demonstrators protest the use of violence by police officers, they experience that violence themselves, being subject to tear gas, rubber bullets, pepper spray, batons, and physical assault.
The strongest voice and protector of our collective human rights in today’s digital world is video evidence of injustices. This content has the potential to spark action and reveal facts, as seen most recently in the case of George Floyd himself.
Often, this content comes to light after being captured by those who risk injury or worse to report on these contentious events. Journalists are specially trained to report on events and willing to share their identity with the public while doing so. They are invaluable in times of crisis for capturing events impartially and accurately. This is why the United States ostensibly has freedom of the press, protected by the First Amendment. In practical terms, freedom of press should allow journalists to be unafraid to do their jobs, expecting that they should be protected to document and report. Unfortunately, these protests are demonstrating that this expectation is far from the truth.
We began noticing violence against reporters at the protests popping up on social media in the United States and started posting the instances we saw on a Twitter thread. This involved collecting videos and images of reports of arrests, violence, and intimidation against journalists across the country.
We also reached out to some journalists and collected additional information when needed. The Twitter thread has now amassed over 140 separate incidents of police violence and other violations against journalists (and counting). The U.S. Press Freedom Tracker is also working on tracking incidents here.
While there has separately been violence against journalists by other protesters, this research focuses on the violence committed by members of police forces. This is due to the principle that police forces should be aware of press freedom at protests and how to protect it. If anything, police should be the ones protecting journalists from other violence that they may encounter during a protest.
We compiled the data we collected into a spreadsheet and plotted each of the incidents using geolocation. We compared the streets, buildings, and specific details in the videos and images until we were able to find, in most instances, the exact spots where these journalists and reporters were standing when they were detained, pepper sprayed, shot with less lethal rounds, or physically assaulted by the police.
This data is publicly available and includes additional research from The Guardian. Aside from location and description, it also tracks whether or not the journalists were identifiable as press, any additional details, and what police force was involved with each incident.
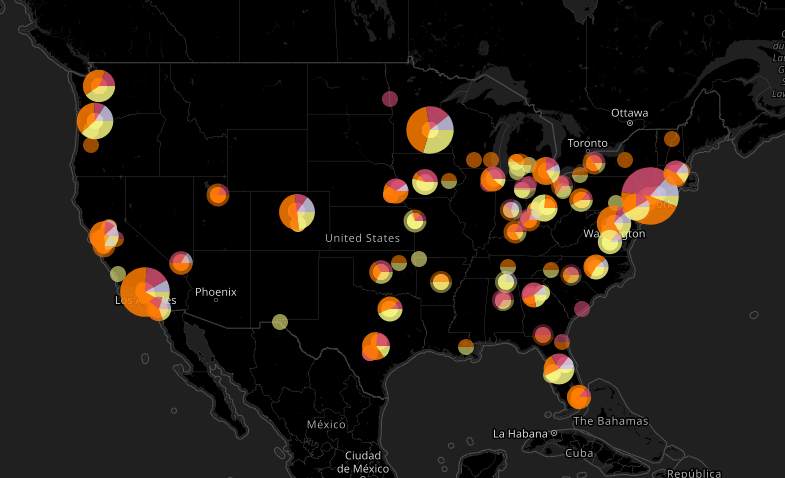
We plotted all of this data onto an interactive map. You can use this map to visualize where these incidents happened in space and time, and notice some areas where multiple instances happened over the course of a protest. This indicates these were not “one time incidents” or accidents due to journalists getting in the way. There is evidence here of systematic and conscious repression of the press at these protests, in cities all across the country — and the data that has been collected is the proof.
The full map of the incidents that we plotted can be seen here.
In total, we have archived 140 incidents involving at least 157 journalists and we will be continuing to track and locate these incidents for as long as they continue to happen, updating our map periodically. To give you perspective on just how enormous this number really is, the U.S. Press Freedom Tracker tracked 150 press freedom violations for the whole of 2019. The incidents in these protests have almost surpassed the 2019 numbers in a week.
With thanks to Nick Waters, Giancarlo Fiorella, Annique Mossou, and Jake Godin for research and collection, and Derek Taylor for his GIS expertise.